The right men for large run-chases
Batsmen and bowlers who do better when the task is bigger
Travis Basevi and George Binoy
30-Sep-2009
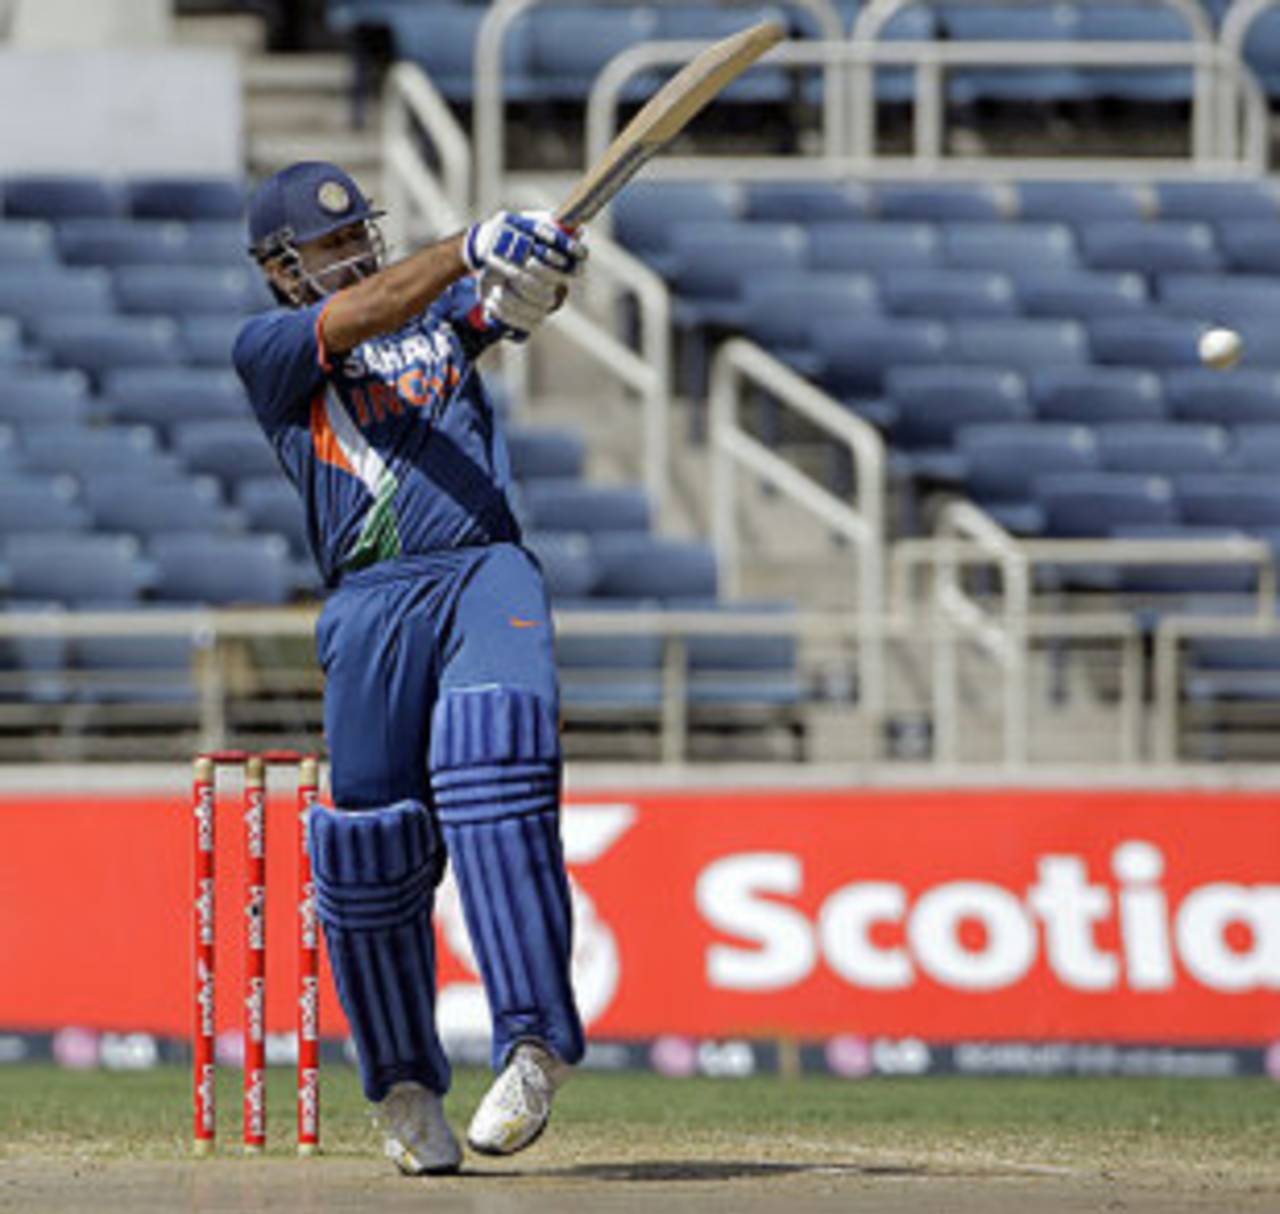
MS Dhoni averages 55.76 when India are chasing more than 275 • Associated Press
No team has successfully chased a total of 275 or more, in five attempts, during the ongoing ICC Champions Trophy. Graeme Smith scored 141 while pursuing England's 323 but contributions from the other batsmen were meagre; Sachin Tendulkar's early dismissal hurt India's shot at overhauling Pakistan's 302; the Sri Lankan engine ran out of steam after New Zealand scored 315; South Africa were thwarted by Ajantha Mendis chasing 319; and West Indies were always going to struggle after Australia posted 275. So this week we've looked at batsmen who make a difference (or don't) in such chases, batsmen with averages significantly higher (and lower) than their career mean while chasing totals greater than 275.
Out of the 20 players in the table below, several - like Adam Parore, Tillakaratne Dilshan and Rashid Latif - have unexceptional averages while chasing scores above 275. However, they appear in the list because their average in large chases is much higher than their overall career average. Dilshan, for instance, averages 31 in ODIs but his mean rises by nine runs when Sri Lanka are chasing more than 275.
There are five players, though - Gary Kirsten, Kevin Pietersen, Ramnaresh Sarwan, Matthew Hayden and MS Dhoni - who have career averages over 40 but raise it to 50 and beyond when their team is faced with a tough chase. Dhoni's 55.76 - seven fifties and one century in 22 innings - is the best of the lot and he has scored 948 runs at a strike-rate of 94.80 in such chases. His overall second-innings average is 53.76, an indicator that his transition from cavalier hitter to urgent accumulator has paid dividends.
Pietersen, on the other hand, averages marginally less in the second innings of ODIs - 1359 runs in 39 innings at 45.30 - than he does overall: his career average is 46.67. However, his average lifts to nearly 55 when England are chasing more than 275. He has scored two centuries and three fifties in 10 such innings but only one of them - the 100 against West Indies in Barbados during the 2007 World Cup - resulted in an England win.
| Player | Span | Inns | NO | Runs | HS | Ave | SR | 100 | 50 | Career | Diff | |
|---|---|---|---|---|---|---|---|---|---|---|---|---|
| Alok Kapali (Ban) | 2002-2008 | 10 | 2 | 305 | 89* | 38.12 | 76.63 | 0 | 2 | 19.83 | 18.29 | |
| HDPK Dharmasena (SL) | 1994-2004 | 11 | 6 | 273 | 69* | 39.00 | 81.98 | 0 | 3 | 22.62 | 16.37 | |
| N Kapil Dev (India) | 1978-1994 | 11 | 3 | 314 | 52 | 39.25 | 92.08 | 0 | 1 | 23.79 | 15.45 | |
| AC Parore (NZ) | 1992-2002 | 16 | 2 | 526 | 108 | 37.57 | 81.67 | 1 | 3 | 25.68 | 11.88 | |
| G Kirsten (SA) | 1993-2003 | 11 | 1 | 520 | 133* | 52.00 | 75.14 | 2 | 3 | 40.95 | 11.04 | |
| ME Waugh (Aus) | 1988-2002 | 14 | 1 | 633 | 113 | 48.69 | 88.53 | 3 | 2 | 39.35 | 9.34 | |
| BB McCullum (NZ) | 2002-2009 | 19 | 5 | 564 | 86* | 37.60 | 90.24 | 0 | 4 | 28.38 | 9.21 | |
| A Jadeja (India) | 1992-2000 | 19 | 2 | 792 | 119 | 46.58 | 81.56 | 2 | 5 | 37.47 | 9.11 | |
| TM Dilshan (SL) | 1999-2009 | 10 | 4 | 321 | 81* | 40.12 | 107.00 | 0 | 1 | 31.38 | 8.73 | |
| V Sibanda (Afr/Zim) | 2003-2009 | 12 | 0 | 366 | 59 | 30.50 | 69.05 | 0 | 3 | 22.06 | 8.43 | |
| KP Pietersen (Eng/ICC) | 2004-2009 | 10 | 1 | 494 | 100* | 54.88 | 101.43 | 2 | 3 | 46.67 | 8.21 | |
| SR Waugh (Aus) | 1986-2002 | 19 | 2 | 698 | 91 | 41.05 | 86.49 | 0 | 5 | 32.90 | 8.15 | |
| RR Sarwan (WI) | 2000-2009 | 23 | 3 | 1021 | 92 | 51.05 | 83.41 | 0 | 10 | 43.04 | 8.00 | |
| Tamim Iqbal (Ban) | 2007-2009 | 10 | 0 | 363 | 154 | 36.30 | 92.83 | 1 | 1 | 28.34 | 7.95 | |
| HH Streak (Afr/Zim) | 1993-2005 | 26 | 12 | 574 | 64* | 35.87 | 83.18 | 0 | 3 | 28.29 | 7.57 | |
| Rashid Latif (Pak) | 1992-2003 | 10 | 3 | 213 | 50 | 26.62 | 85.54 | 0 | 1 | 19.42 | 7.20 | |
| ML Hayden (Aus/ICC) | 1993-2008 | 10 | 0 | 510 | 109 | 51.00 | 88.85 | 1 | 3 | 43.80 | 7.19 | |
| Mohammad Sami (Pak) | 2001-2007 | 10 | 7 | 110 | 46 | 18.33 | 73.33 | 0 | 0 | 11.62 | 6.70 | |
| Aaqib Javed (Pak) | 1988-1998 | 11 | 5 | 101 | 45* | 16.83 | 70.62 | 0 | 0 | 10.68 | 6.15 | |
| MS Dhoni (Asia/India) | 2004-2009 | 22 | 7 | 948 | 183* | 55.76 | 94.80 | 1 | 7 | 49.67 | 6.09 |
Damien Martyn is among the batsmen (the majority) who average higher in the first innings of ODIs than in the second (43.57 compared to 35.87), but his second-innings average plummets drastically when Australia have been set a large target. Martyn went out to bat 13 times when Australia needed 275 or more to win and averaged 11.61 in those innings, never making more than 40. He leads the table of batsmen whose averages are remarkably lower than their career means while chasing a large total.
Scrolling down the list of relatively poor averages while chasing large scores, you'll see 45.91 on the list. Now that's an excellent average to possess even over an entire career, never mind while chasing 275-plus scores, but it begins to make sense when you see that it belongs to Michael Bevan, who averaged 53.58 overall.
| Player | Span | Inns | NO | Runs | HS | Ave | SR | 100 | 50 | Career | Diff | |
|---|---|---|---|---|---|---|---|---|---|---|---|---|
| DR Martyn (Aus) | 1992-2006 | 13 | 1 | 151 | 40 | 11.61 | 67.11 | 0 | 0 | 40.80 | -29.19 | |
| Mohammad Yousuf (Asia/Pak) | 1998-2009 | 32 | 1 | 856 | 92 | 26.75 | 79.40 | 0 | 6 | 42.94 | -16.19 | |
| Saeed Anwar (Pak) | 1989-2003 | 21 | 0 | 486 | 62 | 23.14 | 90.84 | 0 | 2 | 39.21 | -16.07 | |
| HH Dippenaar (Afr/SA) | 1999-2007 | 13 | 2 | 342 | 110* | 28.50 | 79.53 | 1 | 1 | 42.23 | -13.73 | |
| PD Collingwood (Eng) | 2001-2009 | 14 | 1 | 322 | 93 | 23.00 | 82.77 | 0 | 2 | 35.09 | -12.09 | |
| MS Atapattu (SL) | 1990-2007 | 32 | 1 | 817 | 100 | 26.35 | 70.37 | 1 | 2 | 37.57 | -11.21 | |
| SC Ganguly (Asia/India) | 1992-2007 | 41 | 1 | 1242 | 124 | 30.29 | 82.25 | 1 | 8 | 41.02 | -10.72 | |
| AP Gurusinha (SL) | 1985-1996 | 12 | 1 | 216 | 52 | 18.00 | 60.16 | 0 | 1 | 28.27 | -10.27 | |
| MJ Clarke (Aus) | 2003-2009 | 12 | 0 | 399 | 80 | 33.25 | 77.47 | 0 | 4 | 42.62 | -9.37 | |
| V Sehwag (Asia/ICC/India) | 1999-2009 | 31 | 0 | 783 | 119 | 25.25 | 100.77 | 1 | 1 | 34.33 | -9.07 | |
| Kamran Akmal (Pak) | 2002-2009 | 15 | 2 | 250 | 41 | 17.85 | 94.33 | 0 | 0 | 26.29 | -8.43 | |
| SP Fleming (ICC/NZ) | 1994-2007 | 28 | 0 | 675 | 88 | 24.10 | 80.45 | 0 | 5 | 32.40 | -8.30 | |
| VVS Laxman (India) | 1998-2006 | 12 | 0 | 271 | 66 | 22.58 | 77.65 | 0 | 1 | 30.76 | -8.17 | |
| AB de Villiers (Afr/SA) | 2005-2009 | 11 | 0 | 348 | 92 | 31.63 | 97.20 | 0 | 2 | 39.60 | -7.96 | |
| RD Shah (Kenya) | 1998-2007 | 10 | 0 | 200 | 71 | 20.00 | 56.49 | 0 | 1 | 27.88 | -7.88 | |
| DJ Bravo (WI) | 2004-2009 | 17 | 4 | 228 | 33* | 16.28 | 86.69 | 0 | 0 | 23.98 | -7.69 | |
| MG Bevan (Aus) | 1994-2004 | 16 | 5 | 551 | 103 | 45.91 | 84.63 | 1 | 2 | 53.58 | -7.66 | |
| L Klusener (SA) | 1996-2004 | 12 | 3 | 301 | 57 | 33.44 | 96.16 | 0 | 1 | 41.10 | -7.65 | |
| Khaled Mashud (Ban) | 1995-2006 | 23 | 8 | 231 | 53* | 14.43 | 58.04 | 0 | 1 | 21.90 | -7.46 | |
| SR Tendulkar (India) | 1989-2009 | 47 | 0 | 1764 | 141 | 37.53 | 91.73 | 2 | 13 | 44.48 | -6.94 |
How has Sachin Tendulkar fared when India's had to chase scores in excess of 275? He was dismissed for 8 in the Champions Trophy match against Pakistan in Centurion, and averages 37.53, nearly seven runs less than his career average, in such chases.
The table below contains bowlers who have a better economy-rate (compared to career economy-rate) while defending totals less than 200 in ODIs. Tendulkar has a surprisingly low economy-rate when he has bowled after India posted less than 200. He has conceded only 3.92 per over in those matches, compared to 5.09 overall.
If Australia having to chase 275-plus totals only 13 times during Martyn's 208-ODI career is a testament to how effective their bowling was during that period, then the Australian batsmen ensured that the bowling unit had to defend sub-200 totals only 12 times in Glenn McGrath's 250-match career. And McGrath was exceptional in those games, lowering his economy-rate from 3.88 to 2.94 per over.
| Player | Span | Mat | Balls | Runs | Wkts | BBI | Ave | Econ | 4 | 5 | Career | Diff | |
|---|---|---|---|---|---|---|---|---|---|---|---|---|---|
| 3/22 | 20.93 | 3.31 | 0 | 0 | 4.67 | -1.35 | |||||||
| SR Tendulkar (India) | 1989-2009 | 38 | 530 | 347 | 7 | 2/25 | 49.57 | 3.92 | 0 | 0 | 5.09 | -1.16 | |
| 3/26 | 33.12 | 2.94 | 0 | 0 | 4.10 | -1.16 | |||||||
| S Madan Lal (India) | 1974-1987 | 12 | 512 | 262 | 9 | 3/31 | 29.11 | 3.07 | 0 | 0 | 4.05 | -0.98 | |
| 3/37 | 41.05 | 3.24 | 0 | 0 | 4.21 | -0.97 | |||||||
| Shahid Afridi (Asia/ICC/Pak) | 1996-2009 | 29 | 784 | 481 | 20 | 3/16 | 24.05 | 3.68 | 0 | 0 | 4.62 | -0.94 | |
| 3/25 | 22.15 | 2.94 | 0 | 0 | 3.88 | -0.93 | |||||||
| SR Waugh (Aus) | 1986-2002 | 26 | 855 | 520 | 16 | 3/16 | 32.50 | 3.64 | 0 | 0 | 4.56 | -0.91 | |
| 4/17 | 25.84 | 3.41 | 1 | 0 | 4.29 | -0.88 | |||||||
| EJ Chatfield (NZ) | 1979-1989 | 25 | 1225 | 553 | 24 | 4/20 | 23.04 | 2.70 | 1 | 0 | 3.57 | -0.87 | |
| 3/26 | 32.33 | 4.21 | 0 | 0 | 5.07 | -0.85 | |||||||
| A Kumble (Asia/India) | 1990-2007 | 25 | 1152 | 665 | 19 | 4/12 | 35.00 | 3.46 | 1 | 0 | 4.30 | -0.84 | |
| 4/40 | 29.56 | 4.02 | 1 | 0 | 4.84 | -0.82 | |||||||
| SK Warne (Aus/ICC) | 1993-2005 | 10 | 528 | 303 | 13 | 3/29 | 23.30 | 3.44 | 0 | 0 | 4.25 | -0.80 | |
| 6/30 | 21.96 | 3.88 | 0 | 1 | 4.68 | -0.79 | |||||||
| EA Brandes (Zim) | 1987-1999 | 13 | 555 | 374 | 10 | 4/21 | 37.40 | 4.04 | 1 | 0 | 4.80 | -0.76 | |
| 2/21 | 41.88 | 3.83 | 0 | 0 | 4.59 | -0.76 | |||||||
| GRJ Matthews (Aus) | 1984-1993 | 12 | 529 | 311 | 13 | 3/27 | 23.92 | 3.52 | 0 | 0 | 4.28 | -0.75 | |
| 2/26 | 25.91 | 3.39 | 0 | 0 | 4.14 | -0.75 | |||||||
| CJ McDermott (Aus) | 1985-1996 | 18 | 904 | 499 | 21 | 3/23 | 23.76 | 3.31 | 0 | 0 | 4.03 | -0.72 |
Waqar Younis, on the other hand, had to defend totals of 200 or worse 47 times in his 262-ODI career. He rose to the challenge as well, reducing his economy-rate by 0.80, to 3.90 per over, and his average from nearly 24 per wicket to 22.
| Player | Span | Mat | Balls | Runs | Wkts | BBI | Ave | Econ | 4 | 5 | Career | Diff | |
|---|---|---|---|---|---|---|---|---|---|---|---|---|---|
| RGD Willis (Eng) | 1973-1984 | 11 | 550 | 356 | 11 | 2/14 | 32.36 | 3.88 | 0 | 0 | 3.28 | 0.59 | |
| Azhar Mahmood (Pak) | 1996-2007 | 19 | 570 | 480 | 5 | 1/19 | 96.00 | 5.05 | 0 | 0 | 4.62 | 0.42 | |
| PA Strang (Zim) | 1994-2001 | 14 | 585 | 451 | 12 | 4/40 | 37.58 | 4.62 | 1 | 0 | 4.37 | 0.25 | |
| PJ Ongondo (Afr/Kenya) | 1999-2009 | 17 | 545 | 417 | 13 | 4/14 | 32.07 | 4.59 | 1 | 0 | 4.46 | 0.12 | |
| MD Marshall (WI) | 1980-1992 | 15 | 777 | 474 | 14 | 3/28 | 33.85 | 3.66 | 0 | 0 | 3.53 | 0.12 | |
| Abdul Razzaq (Asia/Pak) | 1996-2009 | 33 | 1232 | 984 | 36 | 5/31 | 27.33 | 4.79 | 2 | 1 | 4.68 | 0.10 | |
| MA Suji (Kenya) | 1996-2006 | 17 | 678 | 514 | 12 | 3/23 | 42.83 | 4.54 | 0 | 0 | 4.45 | 0.09 | |
| DK Morrison (NZ) | 1987-1996 | 20 | 900 | 693 | 22 | 5/34 | 31.50 | 4.62 | 0 | 1 | 4.53 | 0.08 | |
| JG Bracewell (NZ) | 1983-1990 | 16 | 620 | 482 | 9 | 2/23 | 53.55 | 4.66 | 0 | 0 | 4.61 | 0.04 | |
| Aaqib Javed (Pak) | 1988-1998 | 24 | 1010 | 717 | 17 | 3/27 | 42.17 | 4.25 | 0 | 0 | 4.28 | -0.02 | |
| BL Cairns (NZ) | 1974-1985 | 16 | 679 | 448 | 9 | 2/30 | 49.77 | 3.95 | 0 | 0 | 4.06 | -0.10 | |
| Mohammad Rafique (Asia/Ban) | 1995-2007 | 35 | 1278 | 919 | 17 | 2/10 | 54.05 | 4.31 | 0 | 0 | 4.43 | -0.11 | |
| Tapash Baisya (Ban) | 2002-2007 | 18 | 695 | 638 | 9 | 2/35 | 70.88 | 5.50 | 0 | 0 | 5.64 | -0.13 | |
| RM Hogg (Aus) | 1979-1985 | 13 | 630 | 400 | 12 | 4/46 | 33.33 | 3.80 | 1 | 0 | 3.94 | -0.13 | |
| JH Kallis (Afr/ICC/SA) | 1996-2009 | 26 | 708 | 553 | 15 | 3/40 | 36.86 | 4.68 | 0 | 0 | 4.82 | -0.13 | |
| GR Larsen (NZ) | 1990-1999 | 22 | 970 | 586 | 10 | 3/20 | 58.60 | 3.62 | 0 | 0 | 3.76 | -0.14 | |
| ST Jayasuriya (Asia/SL) | 1989-2009 | 38 | 963 | 739 | 17 | 4/14 | 43.47 | 4.60 | 2 | 0 | 4.76 | -0.15 | |
| RJ Hadlee (NZ) | 1973-1990 | 24 | 1224 | 640 | 25 | 4/15 | 25.60 | 3.13 | 1 | 0 | 3.30 | -0.16 | |
| RA Harper (WI) | 1983-1996 | 12 | 534 | 338 | 11 | 2/34 | 30.72 | 3.79 | 0 | 0 | 3.97 | -0.18 | |
| MC Snedden (NZ) | 1980-1990 | 20 | 787 | 539 | 15 | 3/40 | 35.93 | 4.10 | 0 | 0 | 4.29 | -0.18 |
If there's a particular List you would like to see, email us with your comments and suggestions.
George Binoy is a senior sub-editor at Cricinfo