Prolific and consistent against allcomers
Considering how consistently prolific Ricky Ponting has been, it was only a matter of time before he became Australia's leading run-getter
S Rajesh
31-Jul-2009
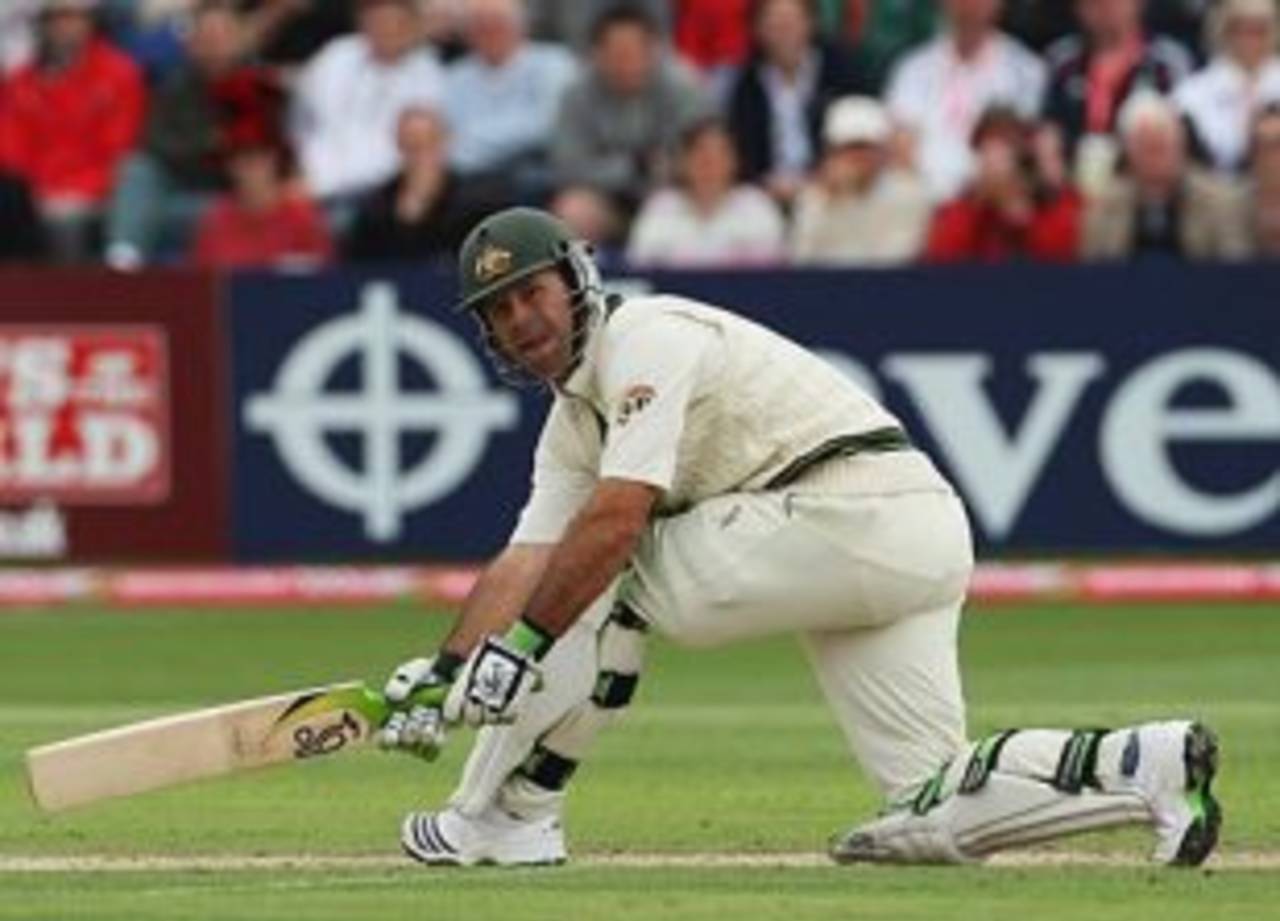
Ricky Ponting has an excellent record in all countries except India • Getty Images
Considering how consistently prolific Ricky Ponting has been over the last eight years, it was only a matter of time before he went on to become Australia's leading run-getter in Tests. The moment finally came when he flicked Andrew Flintoff through midwicket for three runs to go past Allan Border's record of 11,174 on the second day at Edgbaston. Only Brian Lara and Sachin Tendulkar are above him in the all-time list, and Ponting has a fair chance of passing them too before he is done.
With the amount of cricket being played these days, it's only to be expected that most of these aggregate records will be broken due to the sheer number of matches that cricketers play. However, Ponting deserves his record, not only because of the runs he has scored, but also because of the rate at which he has got them: his average of 56.22 is the highest among the top 18 run-getters in Test cricket. (Garry Sobers, with 8032 runs at 57.78, is the first batsman in the list with a higher average.)
It's true that Ponting didn't have to face some of the best bowlers from his era, but he has played enough tough innings in difficult conditions to suggest he would have handled Glenn McGrath and Shane Warne with a fair degree of success as well.
A look at Ponting's progress to the record reveals his outstanding consistency. His average had hovered in the late 40s for much of his early career, but after touching 50 in his 66th Test (averages at the end of the Test) against West Indies in 2003, it has stayed above that mark ever since. (Click here for his career summary.)
| Runs | Tests | Average* | 100s/ 50s |
| 2000 | 32 | 48.25 | 6/ 9 |
| 4000 | 61 | 49.13 | 14/ 16 |
| 6000 | 78 | 54.71 | 20/ 22 |
| 8000 | 100 | 57.71 | 28/ 32 |
| 10,000 | 118 | 58.72 | 35/ 40 |
| 11,188 | 134 | 56.22 | 38/ 46 |
Ponting's consistency extends to his record against each of the opposition teams - he averages more than 47 against every side, and more than 44 in every country where he has played more than one Test except in India. (Click here for his career summary.)
His record in India is the one black mark in an otherwise spotless career - in 12 Tests in that country, he has an aggregate of 438 runs and an average of 20.85. Everywhere else, he has been immense.
There's a theory that Ponting struggles against high-quality spin bowling, and while his stats against Harbhajan Singh justifies that argument - Harbhajan has dismissed him ten times in 12 Tests, the highest among all bowlers - Ponting has done remarkably well in Sri Lanka, averaging more than 54. One of his two centuries there was against Pakistan, but his average against Sri Lanka in Sri Lanka is impressive too - 50.11 in six Tests.
| Host country | Tests | Runs | Average | 100s/ 50s |
| Australia | 73 | 6276 | 60.93 | 20/ 30 |
| Bangladesh | 2 | 191 | 95.50 | 1/ 1 |
| England | 16 | 1166 | 44.84 | 4/ 3 |
| India | 12 | 438 | 20.85 | 1/ 2 |
| New Zealand | 3 | 293 | 97.67 | 1/ 1 |
| Pakistan | 1 | 119 | 119.00 | 0/ 1 |
| South Africa | 9 | 867 | 54.18 | 3/ 4 |
| Sri Lanka | 7 | 599 | 54.45 | 2/ 3 |
| UAE | 2 | 194 | 97.00 | 1/ 0 |
| West Indies | 8 | 1014 | 78.00 | 5/ 1 |
| Zimbabwe | 1 | 31 | 31.00 | 0/ 0 |
Ponting is also one of only five Australian batsmen to score more than 7000 runs at a 50-plus average - Allan Border, Steve Waugh, Matthew Hayden and Greg Chappell are the others. (Don Bradman just misses out, but he is in a league all by himself.)
| Batsman | Tests | Runs | Average | 100/ 50s |
| Ricky Ponting | 134 | 11,188 | 56.22 | 38/ 46 |
| Allan Border | 156 | 11,174 | 50.56 | 27/ 63 |
| Steve Waugh | 168 | 10,927 | 51.06 | 32/ 50 |
| Matthew Hayden | 103 | 8625 | 50.73 | 30/ 29 |
| Greg Chappell | 87 | 7110 | 53.86 | 24/ 31 |
Among these five batsmen, the three who've played most recently - Ponting, Hayden and Waugh - have been a part of winning team far more often than the others. Ponting, Waugh and Chappell, though, have contributed more in victories than the other two, with averages exceeding 60 in Tests that Australia won. Border's average in wins is the lowest, but that's also because for much of his career, he had to fight dogged battles to stave off defeats. Only five of his 27 Test centuries came in wins, but 16 of them helped Australia draw, and in drawn games his average shot up to almost 69.
| Batsman | Tests | Runs | Average | 100s/ 50s |
| Ricky Ponting | 89 | 7683 | 61.95 | 27/ 32 |
| Steve Waugh | 86 | 6460 | 69.46 | 25/ 25 |
| Matthew Hayden | 71 | 6154 | 55.44 | 23/ 19 |
| Greg Chappell | 38 | 3595 | 70.49 | 14/ 16 |
| Allan Border | 50 | 3186 | 51.38 | 5/ 23 |
In terms of contribution to the team's runs, Chappell had the highest percentage among these five, scoring more than 16% of Australia's runs scored off the bat. The numbers are very similar for Ponting and Hayden, while Waugh is down at 12.81%, a reflection of the strength of the other batsmen during his era, and also of his position in the batting line-up.
| Batsman | Runs | Team runs | Percentage |
| Greg Chappell | 7110 | 43,643 | 16.29 |
| Matthew Hayden | 8625 | 57,250 | 15.07 |
| Ricky Ponting | 11,188 | 74,256 | 15.04 |
| Allan Border | 11,174 | 74,837 | 14.93 |
| Steve Waugh | 10,927 | 85,332 | 12.81 |
Apart from Hayden, all these batsmen had significant stints as captains too, and none of them allowed that added responsibility to affect their batting. Ponting leads the way with an average of almost 57 as captain. Chappell follows closely, while Waugh's numbers as captain are particularly remarkable for his conversion rate: overall in his career, Waugh scored 32 hundreds and 50 fifties, but as captain the ratio changed significantly - 15 centuries, and only ten fifties.
| Batsman | Tests | Runs | Average | 100s/ 50s |
| Ricky Ponting | 59 | 5367 | 56.49 | 18/ 25 |
| Greg Chappell | 48 | 4209 | 55.38 | 13/ 19 |
| Steve Waugh | 57 | 3714 | 52.30 | 15/ 10 |
| Allan Border | 93 | 6623 | 50.94 | 15/ 36 |
Another 1585 runs separates Ponting from Tendulkar, as does four Test hundreds. If Ponting does finally get those records, there should be no argument about whether he deserves them.
All stats updated till Ponting's dismissal in the first innings of the Edgbaston Test.
S Rajesh is stats editor of Cricinfo