At his best against the best
Stats analysis of Sachin Tendulkar's Test career
S Rajesh
15-Nov-2009
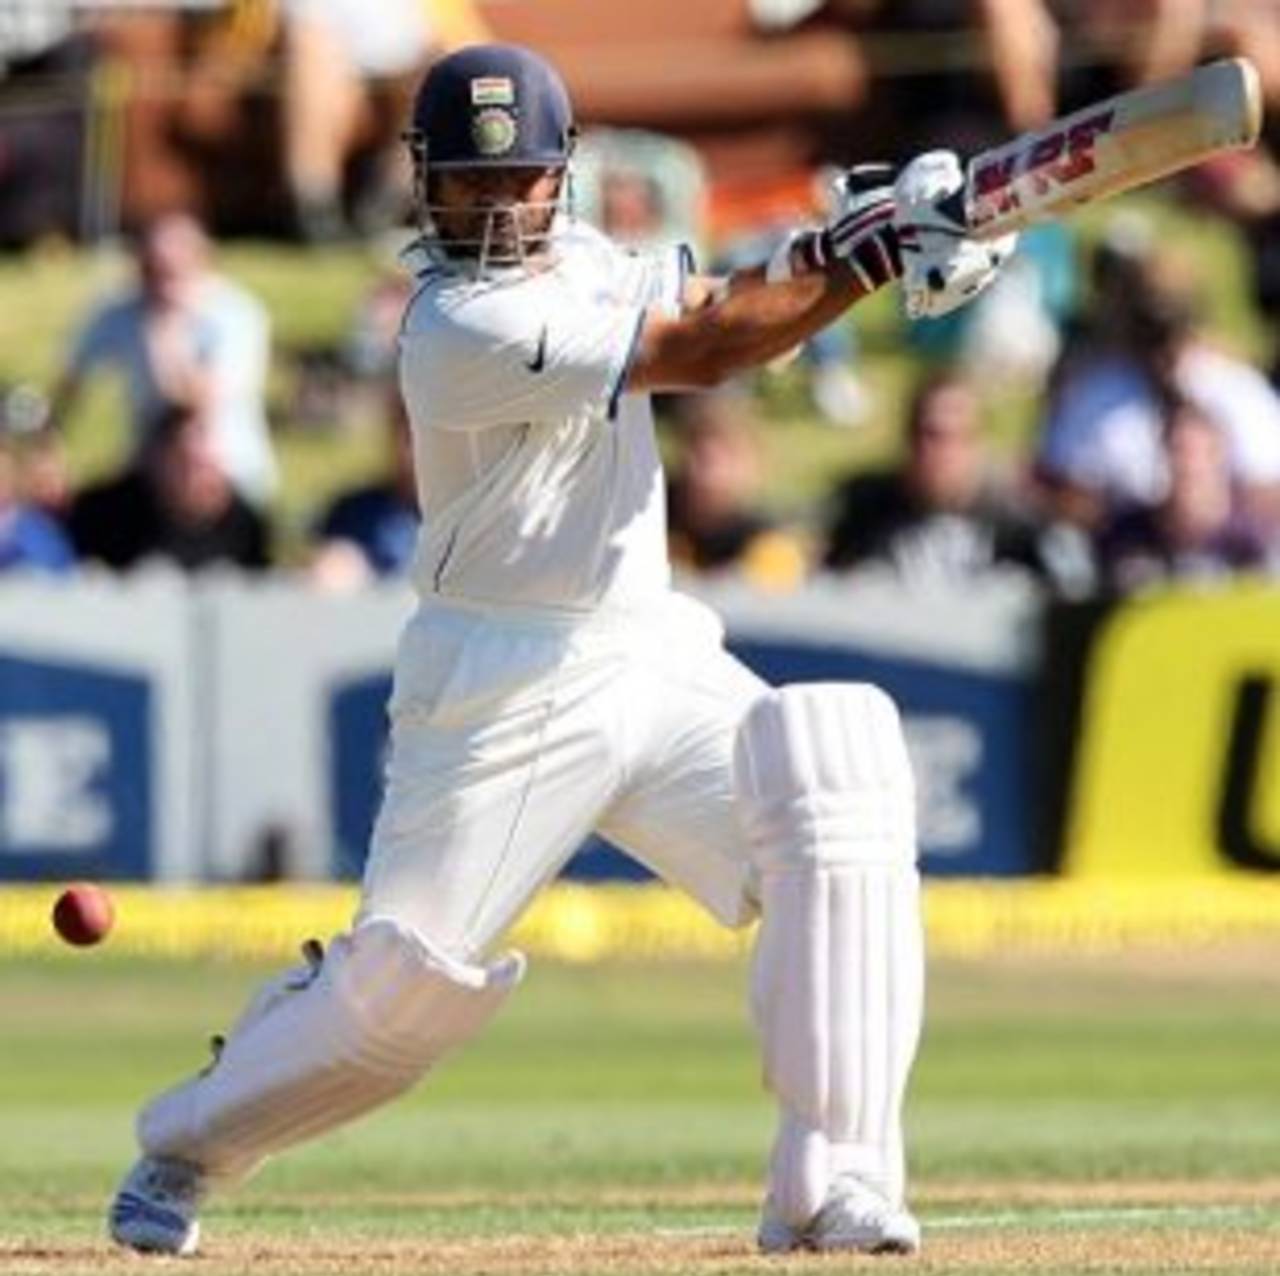
Sachin Tendulkar has maintained a Test average of more than 54 in his last 98 matches • Getty Images
His first Test innings lasted only 24 deliveries, but even during that brief tenure there was something to suggest that Sachin Tendulkar was not just another ordinary cricketer. Twenty years later, it's clear that he has more than just fulfilled those early expectations. Even for someone who was as precocious as Tendulkar looked at 16, it would have been too much to suggest that he would play more than 600 international matches - he is just four short of the landmark - and would score more than 30,000 international runs - he needs 39 more to get to the mark. His stats are ample proof that not only has he been around so long, but also that he has performed at incredibly high levels through most of that period.
In terms of the sheer length of a career, 22 players have played Test cricket over a longer span than Tendulkar. None of them, though, have played anywhere near as many matches. Wilfred Rhodes, for example, played his first Test in 1899, and the last almost 31 years later, in 1930. However, he only played 58 Tests during this period. Similarly, Brian Close's 22-Test career spanned almost 27 years, and John Traicos played seven Tests over a 23-year period. Among the players who've had longer career spans than Tendulkar, only two have played more than 100 Tests - Colin Cowdrey appeared in 114 between November 1954 and February 1975, while Graham Gooch played 118 in a little less than 20 years.
With 159 Tests so far, Tendulkar is only nine short of Steve Waugh's all-time record of 168. The two of them are also in a select group of eight batsmen who've played 125 or more Tests and managed a 50-plus average. Sorting the list by averages, Tendulkar comes in third place, marginally behind two other batting giants of this generation, Ricky Ponting and Jacques Kallis, but ahead of Brian Lara and Rahul Dravid.
| Batsman | Tests | Runs | Average | 100s/ 50s |
| Ricky Ponting | 136 | 11,345 | 55.88 | 38/ 48 |
| Jacques Kallis | 131 | 10,277 | 54.66 | 31/ 51 |
| Sachin Tendulkar | 159 | 12,773 | 54.58 | 42/ 53 |
| Brian Lara | 131 | 11,953 | 52.88 | 34/ 48 |
| Rahul Dravid | 134 | 10,823 | 52.53 | 26/ 57 |
| Sunil Gavaskar | 125 | 10,122 | 51.12 | 34/ 45 |
| Steve Waugh | 168 | 10,927 | 51.06 | 32/ 50 |
| Allan Border | 156 | 11,174 | 50.56 | 27/ 63 |
Six of those batmen have played in an era which has also included a couple of relatively weak teams, Zimbabwe and Bangladesh. Comparing the stats for these players after excluding their performances against these two teams, it emerges that Tendulkar remains in third place and Ponting is still on top, but Brian Lara jumps up to second, while the averages for Dravid and Waugh are pushed to below 50.
Tendulkar's average dips by about two-and-a-half points when excluding his stats against Bangladesh and Zimbabwe, for he has scored 1474 runs - the most by any batsman against these two teams - in 14 Tests at an average of 92.12. Kallis averages 124.50 against them (996 runs in 12 Tests) while Steve Waugh's average against them is a whopping 273 (546 runs and dismissed just twice).
| Batsman | Tests | Runs | Average | 100s/ 50s |
| Ricky Ponting | 128 | 10,695 | 55.12 | 36/ 44 |
| Brian Lara | 127 | 11,558 | 52.53 | 32/ 47 |
| Sachin Tendulkar | 145 | 11,299 | 51.83 | 36/ 50 |
| Jacques Kallis | 119 | 9281 | 51.56 | 27/ 47 |
| Rahul Dravid | 120 | 9423 | 49.59 | 21/ 51 |
| Steve Waugh | 163 | 10,381 | 48.96 | 29/ 48 |
The consistency factor
Over a Test career that's spanned 20 years, one of the most amazing aspects has been Tendulkar's consistency. The last time his average was below 50 was in April 1997, after the fourth Test of the five-match series in the West Indies. In the next game, in Guyana, he scored 83, which pushed his average up to 50.23. Over the next 106 Tests, it's stayed above 50, reaching a high of 58.87 after his 90th Test, when he scored 176 - his 28th Test hundred - against Zimbabwe in Nagpur. In fact, his average hasn't dipped below 54 since the last week of March, 1998, when he played his 61st Test and scored 177 and 31 in the last match of the three-Test series against Australia. The closest he came to slipping below the mark was last year against Australia, when the average dropped to 54.02 after he scored 13 and 49 in the first Test in Bangalore. (Click here for his career cumulative stats. All averages mentioned above at the end of a Test.)
The table below compares these eight players on their consistency levels in Test cricket, by measuring the standard deviation (a measure of how close each score is to the mean). Dividing the average by the standard deviation gives the consistency index. Border leads the way with a relatively low standard deviation of 40.20, while Kallis is only marginally behind him. Tendulkar comes in sixth place, and what hurts his numbers is his relatively high number of sub-20 scores - more than 41% of his total innings have been sub-20 scores. Lara, though, is the only one whose standard deviation is more than his average - his consistency index is, consequently, less than one.
| Batsman | 0-19 (%) | 20-49 (%) | 50-99 (%) | 100+ (%) | Std dev | Ave/ SD |
| Allan Border | 102 (38.49) | 73 (27.55) | 63 (23.77) | 27 (10.19) | 40.20 | 1.26 |
| Jacques Kallis | 80 (36.20) | 59 (26.70) | 51 (23.08) | 31 (14.03) | 43.92 | 1.24 |
| Steve Waugh | 114 (43.85) | 64 (24.61) | 50 (19.23) | 32 (12.31) | 44.45 | 1.15 |
| Ricky Ponting | 78 (34.06) | 65 (28.38) | 48 (20.96) | 38 (16.59) | 50.52 | 1.11 |
| Rahul Dravid | 87 (37.34) | 63 (27.04) | 57 (24.46) | 26 (11.16) | 48.10 | 1.09 |
| Sachin Tendulkar | 108 (41.38) | 58 (22.22) | 53 (20.31) | 42 (16.09) | 52.08 | 1.05 |
| Sunil Gavaskar | 85 (39.72) | 50 (23.37) | 45 (21.03) | 34 (15.89) | 50.01 | 1.02 |
| Brian Lara | 97 (41.81) | 53 (22.84) | 48 (20.69) | 34 (14.66) | 62.56 | 0.85 |
Best against the best
Apart from his sheer longevity, the one aspect of Tendulkar's career which stands out is his performance against the best team of his era. Australia have undoubtedly held that mantle for most of his career, and, ever since that dazzling 114 in Perth, Tendulkar has saved his best for the Australians. In 29 Tests against them Tendulkar has scored ten centuries - the most he's managed against any team - and averages an exceptional 56.08. Even more exceptional is the home and away split - he averages 58.53 in Australia, and 53.30 against them in India.
The average is the highest among batsmen who've scored at least 1000 runs against Australia since 1990. The top three spots are all taken by Indians, while Lara and Kevin Pietersen are the only others to average more than 50 against them during this period.
His stats against Australia is clearly one area where he has distanced himself from his competition - Kallis and Dravid only average in the early 40s against them, while the stats are worse for Inzamam-ul-Haq, another batsman with outstanding overall numbers.
| Batsman | Tests | Runs | Average | 100s/ 50s |
| Sachin Tendulkar | 29 | 2748 | 56.08 | 10/ 11 |
| VVS Laxman | 24 | 2204 | 55.10 | 6/ 10 |
| Virender Sehwag | 15 | 1483 | 51.13 | 3/ 7 |
| Brian Lara | 31 | 2856 | 51.00 | 9/ 11 |
| Kevin Pietersen | 12 | 1116 | 50.72 | 2/ 7 |
| Richie Richardson | 14 | 1084 | 49.27 | 4/ 4 |
| Shivnarine Chanderpaul | 15 | 1210 | 48.40 | 4/ 7 |
| Graham Thorpe | 16 | 1235 | 45.74 | 3/ 8 |
| Graham Gooch | 15 | 1344 | 44.80 | 3/ 9 |
| Rahul Dravid | 27 | 1860 | 41.33 | 2/ 11 |
| Jacques Kallis | 24 | 1664 | 40.58 | 4/ 8 |
S Rajesh is stats editor of Cricinfo