Australia's fall from first to fifth
A look at the major areas where the recent champions have slipped over the last three years
S Rajesh
15-Oct-2010
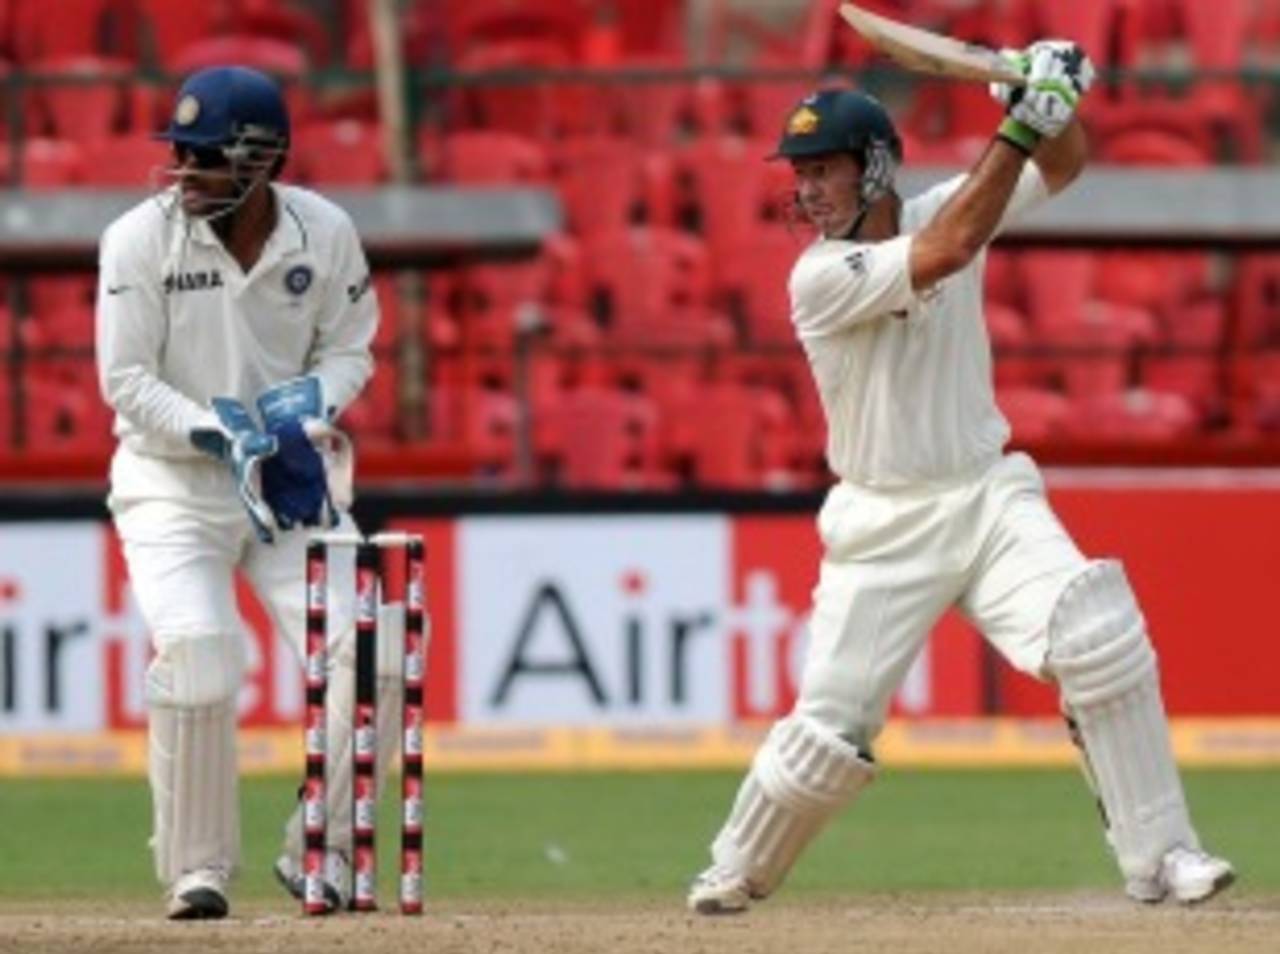
One of the factors in Australia's decline has been the poor conversion rate of their batsmen, and Ricky Ponting has been one of the biggest culprits • Getty Images
It's almost surreal, but according to the latest ICC rankings, Australia are the fifth-best Test team in the world. It was always expected that they would struggle a bit after the retirement of their stalwarts, but the swiftness with which they've plummeted down the rankings has been a bit of surprise, especially since they won just about everything till the end of 2007. Admittedly Australia's standards have fallen since those lofty days, but is fifth position a true reflection of how good they are? Here's a look at their results summary over the last three years, and a comparison with what they achieved between 2005 and 2007.
The first stat that jumps out is the number of Tests they've lost since 2008: against the top eight teams (excluding Bangladesh), Australia have won 17 Tests and been beaten 11 times, which is more than the number of defeats they'd endured in the previous eight years (2000 to 2007). The 2-0 defeat to India was the first whitewash they'd suffered in a series since 1982, when they lost to Pakistan, and they've also lost three Tests in a row for the first time in almost 22 years.
Despite these defeats Australia still have a win-loss ratio of more than 1.5, which is not bad for a team ranked fifth. The problem, from Australia's point of view, is that four other teams have done better in these three years - India, South Africa, England and Sri Lanka all have a better win-loss ratio against the top eight teams during this period. That also indicates how closely matched these five teams have been, and how poor the others are: fifth-placed Australia have a win-loss ratio of 1.54, while Pakistan, in sixth place, have a ratio of 0.30. In the three-year period before this (January 2005 to December 2007), Australia were the only team with a win-loss ratio of more than 1.50, while in the three years before that, two teams, Australia and England, made the grade.
| Team | Tests | Won | Lost | W/L ratio |
| India | 28 | 13 | 6 | 2.16 |
| South Africa | 24 | 12 | 7 | 1.71 |
| England | 32 | 13 | 8 | 1.62 |
| Sri Lanka | 18 | 8 | 5 | 1.60 |
| Australia | 35 | 17 | 11 | 1.54 |
| Pakistan | 17 | 3 | 10 | 0.30 |
| West Indies | 22 | 2 | 11 | 0.18 |
| New Zealand | 20 | 2 | 12 | 0.16 |
Australia have also been hurt by the fact that they've played more matches away than at home during these last three years. Out of the 35 Tests, 21 have been away and only 14 at home. They've still been more consistent home and away compared to most other teams, though - their home win-loss ratio is third-best, next only to India and Sri Lanka. Overseas they are second only to South Africa, and tied with India. Yet overall they slip into fifth place because of the home-away equation of the other teams. While Australia have played 60% of their games away (including at neutral venues), India have played only 43% overseas, and for Sri Lanka the number is less than 40%. For Sri Lanka, especially, the home-away ratio has helped tremendously, for their overseas win-loss ratio ranks fifth among all teams, but their awesome home record gives them an overall ratio of 1.60, which helps them pip Australia.
| Team | Home - Tests | W/ L | Ratio | Away* - Tests | W/ L | Ratio |
| India | 16 | 9/ 2 | 4.50 | 12 | 4/ 4 | 1.00 |
| South Africa | 9 | 4/ 3 | 1.33 | 15 | 8/ 4 | 2.00 |
| Sri Lanka | 11 | 7/ 2 | 3.50 | 7 | 1/ 3 | 0.33 |
| England | 18 | 10/ 4 | 2.50 | 14 | 3/ 4 | 0.75 |
| Australia | 14 | 9/ 3 | 3.00 | 21 | 8/ 8 | 1.00 |
| Pakistan | 2 | 0/ 0 | 0.00 | 15 | 3/ 10 | 0.30 |
| West Indies | 13 | 2/ 5 | 0.40 | 9 | 0/ 6 | 0.00 |
| New Zealand | 13 | 2/ 6 | 0.33 | 7 | 0/ 6 | 0.00 |
In the three years before 2008, though, Australia were the emphatic champions, which is what makes their current ranking so shocking. In 26 Tests against the top eight teams during this period, Australia won 20 and lost two - both to England in 2005 - for an outstanding win-loss ratio of 10. During this period they won 13 Tests in a row, which included a 5-0 whitewash of England in the Ashes series at home in 2006-07. Australia didn't lose a single home game in these three years, winning 14 out of 15, but they were also awesome overseas, winning six and losing only two out of 11 games. They were the only team with an away win-loss ratio of more than one.
The home-away schedule also worked to their advantage during this period (though it's not as if they needed help from such external factors). Out of 26 Tests, they played 15 at home and 11 away. India, on the other hand, had a 12-14 home-away spread, while Sri Lanka played nine at home and 12 abroad.
| Team | Overall - W/L | Ratio | Home - W/L | Ratio | Away - W/L | Ratio |
| Australia | 20/ 2 | 10.00 | 14/ 0 | - | 6/ 2 | 3.00 |
| India | 8/ 6 | 1.33 | 5/ 2 | 2.50 | 3/ 4 | 0.75 |
| South Africa | 12/ 11 | 1.09 | 9/ 7 | 1.28 | 3/ 4 | 0.75 |
| Pakistan | 9/ 10 | 0.90 | 5/ 1 | 5.00 | 4/ 9 | 0.44 |
| Sri Lanka | 7/ 8 | 0.87 | 5/ 1 | 5.00 | 2/ 7 | 0.28 |
| England | 11/ 13 | 0.84 | 9/ 3 | 3.00 | 2/ 10 | 0.20 |
| New Zealand | 4/ 7 | 0.57 | 4/ 3 | 1.33 | 0/ 4 | 0.00 |
| West Indies | 2/ 16 | 0.12 | 1/ 4 | 0.25 | 1/ 12 | 0.08 |
Comparing Australia's batting stats between 2005 and 2007 to their performances since the beginning of 2008, the most glaring difference is that in conversion rates of batsmen then and now. During the first phase, Australian batsmen converted 41 of their 98 scores of 50-plus into hundreds - a conversion rate of nearly 42%. Since 2008, though, that percentage has dropped to 29% (43 out of 149). That tendency to get starts and not go on to a century was on display against India too, when there were nine scores of more than 50 but only Shane Watson and Marcus North got a century each. Ricky Ponting was the biggest culprit on this count - he batted beautifully and crafted three 50-plus scores, but the highest of those was only 77.
Over the last three years, the four batsmen who've had the poorest conversion rates have been Ponting, Watson, Simon Katich and Michael Hussey. Katich has been the best among these players, but even he converted only eight of his 24 scores of 50-plus into hundreds. For Ponting the corresponding ratio was six out of 17, while Hussey had four out of 13 and Watson two out of 11.
In contrast the batsmen were far more ruthless in the three years preceding 2008: Ponting converted 12 of his 22 scores of 50-plus into centuries, Matthew Hayden seven out of 13, Hussey six out of 14, and Adam Gilchrist four out of nine.
| Period | Tests | Runs | Average | 100s/ 50s |
| Jan 2005 to Dec 2007 | 26 | 14,898 | 43.30 | 41/ 57 |
| Jan 2008 onwards | 35 | 20,382 | 36.39 | 43/ 106 |
Among the bowlers, the main difference is in the averages of the top wicket-takers during these two periods. Between 2005 and 2007 all the bowlers who took more than 50 wickets averaged less than 28, with one of them, Stuart Clark, averaging less than 20. In the last three years, though, all those who have taken more than 50 wickets have averaged greater than 28, with three of them conceding more than 30 runs per wicket. That's resulted in an overall higher average for bowlers. Combine that with the lower batting averages and it has meant that the difference between batting and bowling averages has dropped considerably during the last three years - between 2005 and 2007 it was 15.72; in the last three years it has slipped to 3.60. That's been enough for Australia's rank to slip from one to five.
| Period | Tests | Wickets | Average | Strike rate | 5WI/ 10WM |
| Jan 2005 to Dec 2007 | 26 | 482 | 27.58 | 54.8 | 17/ 2 |
| Jan 2008 onwards | 35 | 601 | 32.79 | 61.8 | 20/ 3 |
S Rajesh is stats editor of Cricinfo