Testing times for Dravid and Ponting
They've been outstanding No. 3 batsmen, but over the last four years their numbers have dropped significantly
S Rajesh
01-Oct-2010
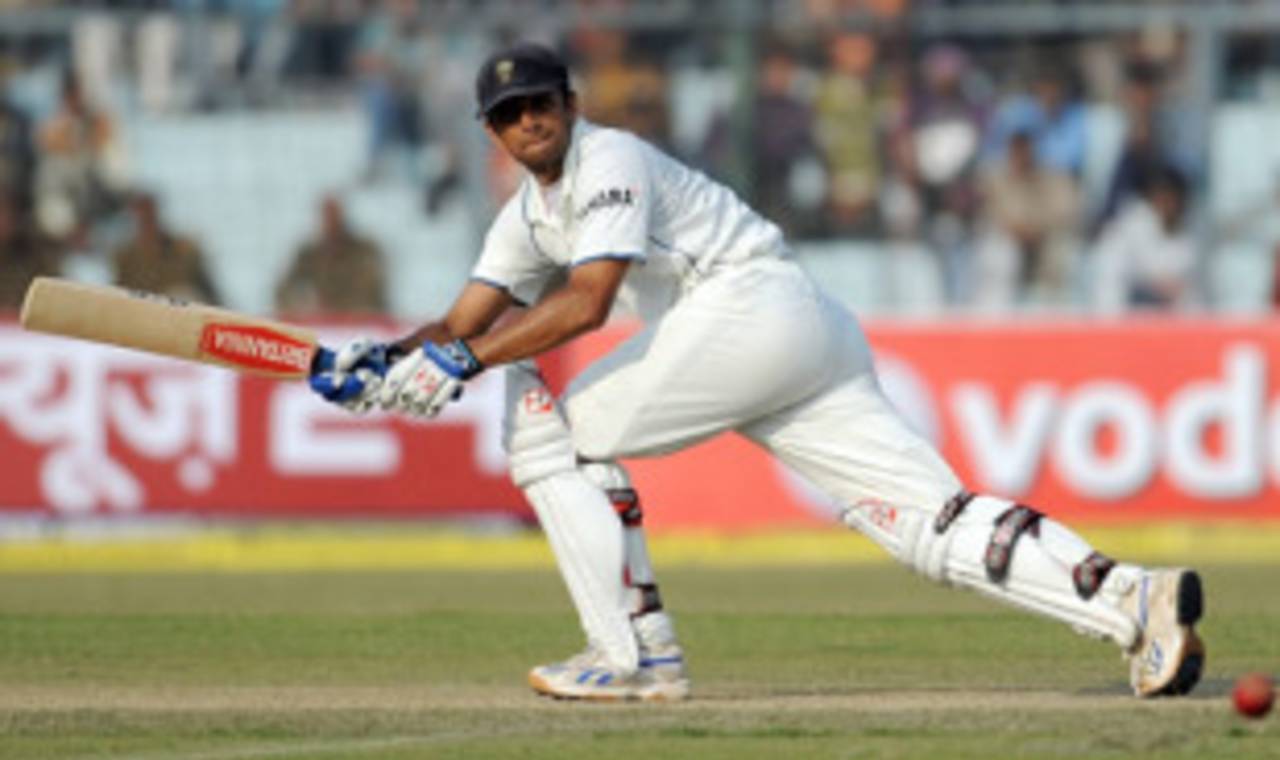
Rahul Dravid's career average has gone down by nearly five runs since the beginning of 2007 • AFP
When a list is drawn up of the greatest Test batsmen of the modern era, no one will question the right of these two players to find prominent places in it: Ricky Ponting and Rahul Dravid made their Test debuts within seven months of each other in the mid-1990s, and have been outstanding champions over the last decade and a half. Both have led their team's batting units for a significant part of the 2000s, and are in a league of their own as No. 3 batsmen, being the only ones to score more than 9000 runs at that position.
Over the last few years, though, their lustre has been wearing off just a bit, which makes the next couple of weeks - and indeed, the next few months - vital for both: among the several head-to-head battles worth checking out in the two-Test India-Australia series is this one between the two aging one-drop batsmen. Beyond this series too, both teams have a severely testing calendar over the rest of this season - India tour South Africa, a country that has arguably the most seamer-friendly conditions today, while Australia host an England team who, after many years, seem capable of winning an Ashes series overseas.
These are reasons why both teams will be hoping their No.3s shrug off the sluggish form that has dogged them over the last four years. Both Ponting and Dravid are used to being at - or near - the top of the batting charts, but since 2007 their stats have dropped off sharply. During this period, 22 batsmen have scored more than 2000 Test runs, and Dravid and Ponting are in the bottom seven among them in terms of averages. Dravid's average of 40.54 is the worst, while 15 batsmen have a better average than Ponting's 42.90. None of those 22 batsmen have scored fewer than the six hundreds that Ponting and Dravid have managed during this period.
| Batsman | Tests | Runs | Average | 100s/ 50s | Strike rate | Balls per dismissal |
| Rahul Dravid | 36 | 2392 | 40.54 | 6/ 12 | 42.93 | 94.43 |
| Michael Hussey | 37 | 2421 | 41.03 | 6/ 13 | 45.41 | 90.35 |
| Paul Collingwood | 44 | 2760 | 41.19 | 7/ 16 | 48.98 | 84.10 |
| Alastair Cook | 47 | 3351 | 41.88 | 9/ 19 | 49.73 | 84.21 |
| Ian Bell | 35 | 2344 | 42.61 | 6/ 13 | 50.01 | 85.20 |
| Andrew Strauss | 42 | 2986 | 42.65 | 8/ 13 | 49.43 | 86.28 |
| Ricky Ponting | 37 | 2703 | 42.90 | 6/ 16 | 61.45 | 69.81 |
Not only have Dravid and Ponting struggled when compared to the best in the world, they've also failed to keep pace with the best in their own teams. There used to be a time when Ponting was unquestionably the best batsman in Australia, but now that mantle has been taken over by Michael Clarke, while Simon Katich too has scored far more consistently than Ponting. It's not as if runs have completely eluded Ponting - among his six hundreds was a memorable 123 against India in Bangalore, his first century in the country, 101 and 99 in the Boxing Day Test against South Africa in 2008, and 150 in the first Ashes Test in Cardiff - but those high scores have been offset by too many low ones. (Click here for Ponting's innings-by-innings list since 2007.)
| Batsman | Tests | Runs | Average | 100s/ 50s |
| Michael Clarke | 36 | 3013 | 55.79 | 10/ 14 |
| Simon Katich | 29 | 2721 | 54.42 | 8/ 16 |
| Ricky Ponting | 37 | 2703 | 42.90 | 6/ 16 |
| Michael Hussey | 37 | 2421 | 41.03 | 6/ 13 |
| Shane Watson | 17 | 1166 | 38.86 | 1/ 9 |
| Brad Haddin | 27 | 1545 | 38.62 | 2/ 5 |
| Marcus North | 17 | 981 | 37.73 | 4/ 4 |
For Dravid, the situation is worse. In a line-up of heavyweight batsmen, his average is the poorest among the regular players; while three batsmen have averages of more than 60, Dravid's barely touches 40.
What's also been worrying is the spread of those runs: Dravid used to be India's best bet overseas, but four of his six hundreds during this period have come in India, and the other two were scored in Bangladesh. His one good series abroad was in New Zealand, but he failed to convert his half-centuries into something more substantial: he made four fifties in six innings, but none exceeded 83. Excluding his innings in Bangladesh, his overseas average during this period drops to 33.20, with no centuries in 33 innings. That doesn't augur well for a team who have a tour to South Africa coming up.
| Batsman | Tests | Runs | Average | 100s/ 50s |
| Gautam Gambhir | 19 | 2116 | 62.23 | 8/ 8 |
| Virender Sehwag | 28 | 2928 | 61.00 | 9/ 10 |
| Sachin Tendulkar | 35 | 3247 | 60.12 | 13/ 14 |
| VVS Laxman | 34 | 2551 | 57.97 | 6/ 18 |
| MS Dhoni | 31 | 1850 | 48.68 | 3/ 15 |
| Rahul Dravid | 36 | 2392 | 40.54 | 6/ 12 |
The drop in form over the last four years has meant that almost five runs have been lopped off the career averages of both players - Ponting's has dropped from nearly 60 to less than 55, while Dravid's has come down to less than 53 from a high of 57.58. For Ponting, what's noticeable is his poor conversion rate: during his prime he used to convert one out of two 50-plus scores into a hundred, but since 2007 that rate has fallen to one in nearly four (six out of 22). For Dravid, surprisingly, the ratio remains exactly the same before and during these four years.
| Period | Tests | Runs | Average | 100s/ 50s |
| Till Dec 2006 | 109 | 9323 | 59.38 | 33/ 36 |
| From Jan 2007 | 37 | 2703 | 42.90 | 6/ 16 |
| Career | 146 | 12,026 | 54.66 | 39/ 52 |
| Period | Tests | Runs | Average | 100s/ 50s |
| Till Dec 2006 | 106 | 9098 | 57.58 | 23/ 46 |
| From Jan 2007 | 36 | 2392 | 40.54 | 6/ 12 |
| Career | 142 | 11,490 | 52.94 | 29/ 58 |
For both batsmen, the tendency to get out early in the innings is more marked: Ponting and Dravid used to get out for less than 20 once every three innings, roughly, when they were in form; now that percentage has increased considerably. Of the 60 innings Dravid has played since 2007 (excluding unbeaten sub-20 innings), he has been dismissed for less than 20 on 27 occasions, which is a whopping 45%. Five of those 27 dismissals were in the four Tests when Australia toured India in 2008: of the seven times he batted in that series, only twice did he top 15.
| Batsman | Inngs before 2007* | Out for < 20 | Percentage | Inngs since Jan 2007* | Out for < 20 | Percentage |
| Ricky Ponting | 178 | 55 | 30.90 | 65 | 26 | 40.00 |
| Rahul Dravid | 180 | 57 | 32.02 | 60 | 27 | 45.00 |
Obviously the slump has also adversely affected their stats at No. 3, with both batsmen averaging around 43 at this slot during these four years. Several other batsmen have done better in this position, most notably Kumar Sangakkara (average 71.64, with 10 centuries in 27 Tests) and Hashim Amla of South Africa (average 52.70; eight hundreds in 37 matches). (Click here for the full list of No. 3 batsmen during this period.)
| Batsman | Innings | Runs | Average | 100s/ 50s |
| Ricky Ponting | 64 | 2701 | 43.56 | 6/ 16 |
| Rahul Dravid | 54 | 2198 | 43.09 | 6/ 11 |
And finally, here's a comparison of the performances of the two at No. 3, sorted by the score at which they've come in to bat. Again, the numbers don't flatter Dravid. Ponting has averaged more or less the same regardless of the score at which he has come in, but Dravid has clearly preferred situations when the openers have put together a substantial first-wicket partnership, which is another indication that his level has dropped - when he was at his peak, he relished situations that required him to repair the damage of an early setback.
Since 2007, Dravid has come in to bat 22 times when the openers have been separated with less than 20 on the board, and he has only scored two centuries - 136 against England in Mohali when the first wicket fell at 6, and 177 against Sri Lanka in Ahmedabad, when the opening pair was separated at 14. On the other hand, he has failed to touch 20 on 10 of those 22 innings.
When the openers have added between 20 and 75, Dravid's average has increased to almost 41, but his conversion rate has been abysmal in these instances, with seven fifties and no hundred. And when the openers have laid a good platform, Dravid has helped himself to an average score of more than 52. In fact, all four of his hundreds have come when the openers have added more than 100 - two of those were against Bangladesh, while the other two followed double-century opening stands, in Kanpur and Ahmedabad.
For Ponting, the numbers are far more consistent, but then he has failed to take advantage of good starts. Clearly, over the next few months both batsmen need to raise their game. Given their past record, there's no reason to suggest they can't.
| Point of entry score | Batsman | Innings | Runs | Average | 100s/ 50s |
| <=20 for 1 | Ricky Ponting | 20 | 842 | 42.10 | 2/ 6 |
| Rahul Dravid | 22 | 811 | 38.62 | 2/ 3 | |
| >20 and <=75 for 1 | Ricky Ponting | 29 | 1286 | 44.34 | 3/ 6 |
| Rahul Dravid | 17 | 654 | 40.88 | 0/ 7 | |
| >75 for 1 | Ricky Ponting | 15 | 573 | 44.08 | 1/ 4 |
| Rahul Dravid | 15 | 733 | 52.36 | 4/ 1 |
S Rajesh is stats editor of Cricinfo