To bat or field first, and the busiest batsmen
A look at the more profitable option in Twenty20 internationals, and the batsmen who play the least number of dot balls
S Rajesh
30-Apr-2010
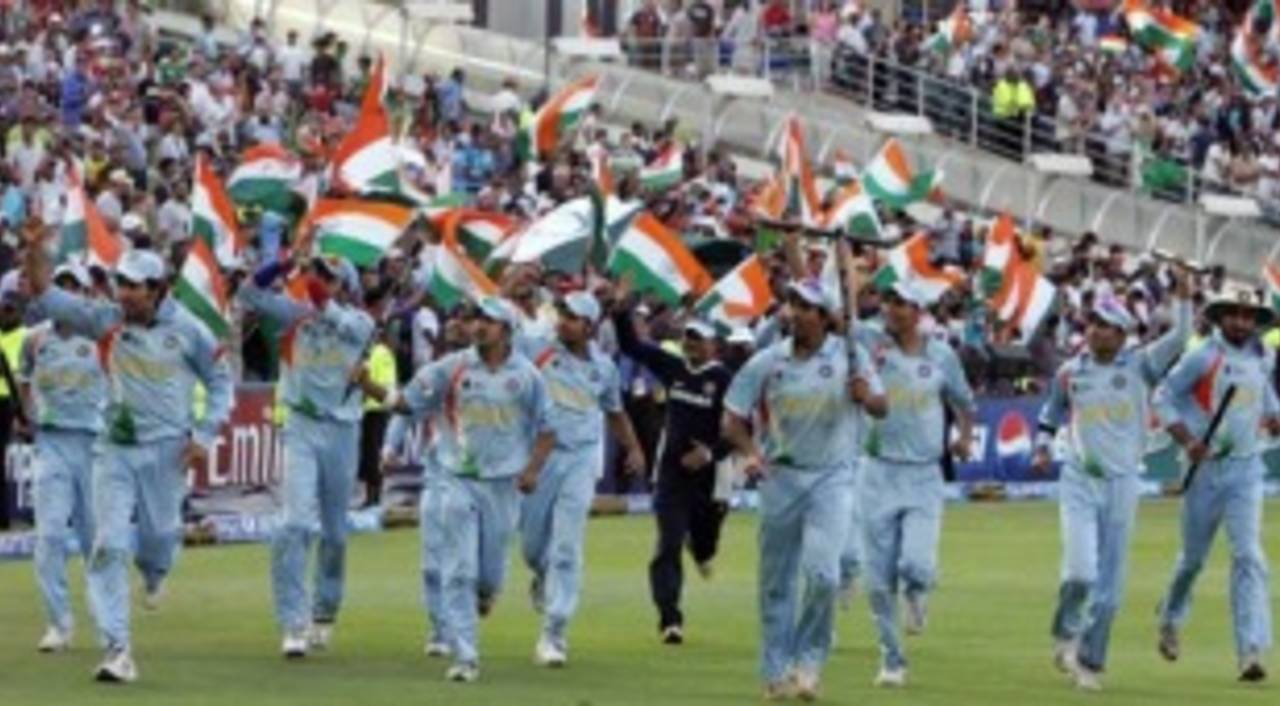
India triumphed in the 2007 World Twenty20 final after batting first, but overall batting first hasn't given teams much advantage in Twenty20 internationals • Getty Images
The 20-over format is still a relatively new one, which means teams are still grappling with complex issues like par scores for the team batting first, and whether batting first or chasing is a more profitable option. The conditions obviously play a part, but unlike in an ODI, where a pitch can change considerably over 100 overs, there is less likelihood of the surface altering drastically within 40 overs. The stats from the Twenty20 internationals so far - admittedly a fairly small number still - indicate that there's very little to choose in terms of the overall advantage for the team batting first or second.
In 142 matches which have produced a decisive winner (excluding washouts and ties), 75 have been won by the team chasing, which is eight more than the matches won by the team batting first. In terms of percentages, that's hardly a significant difference, 53% to 48%. When narrowing the analysis to only the top ten teams (the nine Test-playing nations plus Zimbabwe), the difference becomes even more marginal. In the two World Cups played so far, too, the difference is marginal.
| Total results | Won by team batting first | Won by team batting second | |
| All Twenty20 internationals | 142 | 67 (47.18%) | 75 (52.82%) |
| Involving top ten teams | 101 | 50 (49.50%) | 51 (50.50%) |
| In Twenty20 World Cups | 52 | 28 (53.85%) | 24 (46.15%) |
| T20 World Cups, top ten teams | 40 | 21 (52.50%) | 19 (47.50%) |
In the three editions of the IPLs, though, it's clear that teams have gradually got the hang of batting first and setting a target - each year the percentage of matches won by the side batting first has been more than the previous one. In the first year, the team batting first got it right only 22 times out of 58 (a percentage of less than 38), but that's increased to 46% in 2009 and more than 52% in the latest edition. Apart from the familiarity with the format itself, what's probably also helped the side batting first is number of matches played in similar conditions, which helps teams get a pretty good idea of a winning total in those conditions.
| Year | Total results | Won by team batting first | Won by team batting second |
| 2008 | 58 | 22 (37.93%) | 36 (62.07%) |
| 2009 | 56 | 26 (46.43%) | 30 (53.57%) |
| 2010 | 59 | 31 (52.54%) | 28 (47.46%) |
Only four countries have so far hosted ten or more Twenty20 internationals involving the top ten teams, with the highest numbers in the countries in which the two World Twenty20 internationals were played. South Africa has favoured the team chasing, while in England the side batting first has had a slightly higher win percentage (though, admittedly, the analyses is hampered by the lack of sufficient matches in most countries.
| Host | Total results | Won by team batting first | Won by team batting second |
| South Africa | 34 | 15 (44.12%) | 19 (55.88%) |
| England | 24 | 14 (58.33%) | 10 (41.67%) |
| Australia | 10 | 7 (70%) | 3 (30%) |
| New Zealand | 10 | 4 (40%) | 6 (60%) |
And to get an idea of the kind of scores that win Twenty20 games, here's a quick look at past scores and results: in matches involving the top ten teams, 46 times the team batting first has scored 160 or more, and 32 times it's been a winning total (69.57%). Change the score to 170 or more, and the winning record changes to 28 out of 32 (87.50%); for a score between 140 and 159, though, the winning percentage is exactly 50%. All these numbers might not be too relevant to the West Indies, though, because the pitches there have produced very low scores: there have only been four Twenty20 internationals there, with the average run rate being 6.44, which converts into a 50-over score of 129.
Of dot balls and boundaries
With the pitches in the West Indies expected to be slow, the scores in the World Twenty20 might not be as high as we've come to expect in this format. If the warm-up games and the other Twenty20 internationals in the West Indies are any indications, then boundaries will be tough to find, which could put the onus on batsmen to make every ball count with singles and twos. It's likely, then, that the batsmen who take the honours will be those who play the least number of dots, not necessarily those who play the biggest shots. If that's the case, then let's look at those who waste the least number of deliveries.
Among those who've faced at least 250 deliveries in Twenty20 internationals, the top two batsmen who've played the least number of dot balls are both in the England middle order: Kevin Pietersen and Paul Collingwood have a dot-ball percentage of less than 30%, and both have a strike rate of around eight-and-a-half per over. That's pretty impressive, because some of the other names in the table have fairly ordinary scoring rates - MS Dhoni scores at only 6.35 per over, while Misbah-ul-Haq, Younis Khan and JP Duminy all hover around the 7.5 mark. Yuvraj is the exception, with a rate close to ten per over.
| Batsman | Runs | Balls | Average | Run rate | Dot-ball % |
| Kevin Pietersen | 663 | 463 | 33.15 | 8.59 | 28.73 |
| Paul Collingwood | 475 | 341 | 23.75 | 8.35 | 29.03 |
| Shahid Afridi | 475 | 327 | 20.65 | 8.71 | 31.19 |
| Younis Khan | 432 | 346 | 28.80 | 7.49 | 33.24 |
| Yuvraj Singh | 481 | 291 | 37.00 | 9.91 | 33.33 |
| Jacob Oram | 378 | 272 | 23.62 | 8.33 | 34.19 |
| Misbah-ul-Haq | 509 | 421 | 46.27 | 7.25 | 34.20 |
| JP Duminy | 372 | 300 | 26.57 | 7.44 | 34.33 |
| Kumar Sangakkara | 572 | 451 | 35.75 | 7.60 | 34.37 |
| MS Dhoni | 356 | 336 | 29.66 | 6.35 | 34.82 |
And what about the biggest boundary hitters, who're listed below? They might not find it as easy to clear the boundaries in this tournament, but for the sake the spectators let's hope at least some of them come into their own over the next couple of weeks.
| Batsman | Runs | Average | Run rate | 4s/ 6s | % runs in 4s, 6s |
| Sanath Jayasuriya | 606 | 27.54 | 8.20 | 74/ 23 | 71.62 |
| Chris Gayle | 471 | 36.23 | 8.69 | 46/ 25 | 70.91 |
| Graeme Smith | 642 | 35.66 | 7.86 | 84/ 18 | 69.16 |
| Yuvraj Singh | 481 | 37.00 | 9.91 | 29/ 35 | 67.78 |
| David Warner | 452 | 34.76 | 9.31 | 43/ 21 | 65.93 |
| Herschelle Gibbs | 359 | 18.89 | 7.77 | 43/ 10 | 64.62 |
| Albie Morkel | 361 | 25.78 | 8.36 | 24/ 22 | 63.16 |
| Brendon McCullum | 987 | 41.12 | 7.99 | 98/ 38 | 62.82 |
| Jacob Oram | 378 | 23.62 | 8.33 | 29/ 18 | 59.26 |
| Tillakaratne Dilshan | 607 | 33.72 | 7.73 | 73/ 11 | 58.98 |
S Rajesh is stats editor of Cricinfo