A lowdown on batting Powerplays
A look at what the numbers suggest about the latest innovation in one-day cricket
S Rajesh
06-Nov-2009
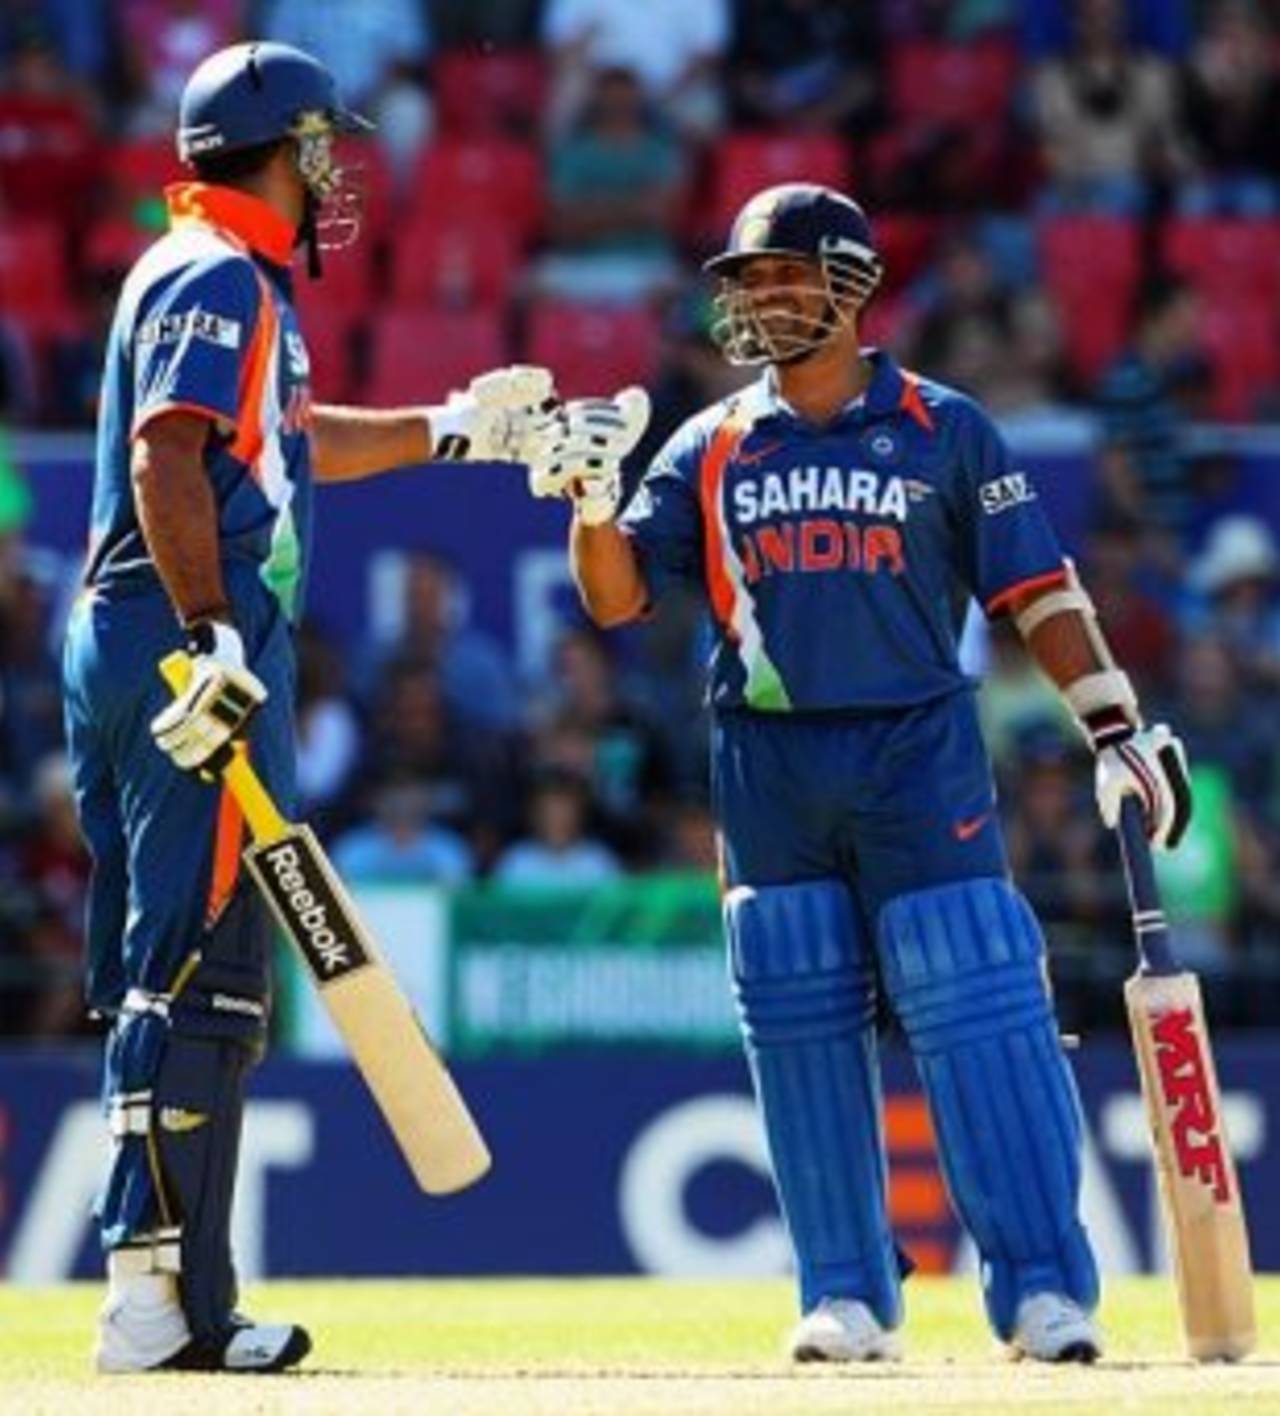
Yuvraj Singh and Sachin Tendulkar combined to blast 69 in a batting Powerplay in Christchurch • Getty Images
It's the latest innovation in one-day cricket, and unlike some of the other gimmicks that have been tried recently, this one looks like it's here to stay. When it first came in, the batting Powerplay seemed like just one more weapon for the batting team with which to shower boundaries upon the hapless opposition.
However, what makes it a not-so-straightforward innovation is the fact that the batting side needs to decide when to take it. Should it be taken relatively early in the innings, to upset the plans of the opposition captain and bowlers, or is the weapon at its most potent in the final overs, when the batting side has little to lose anyway? It's been a hotly debated topic, and while many experts suggest taking it early, the batsmen themselves have been loathe to disturb their rhythm in the middle overs and look for boundaries during a period which has traditionally been one for taking singles.
The batting Powerplay was introduced in October 2008, and in 13 months, teams have used it with mixed success. Overall, these five overs have gone at about seven-and-a-half runs per over, and about 22 runs per wicket, which makes for an average score of about 38 for 2. The average score obviously comes down due to instances when teams had already lost plenty of wickets when they took the Powerplay, thus completely negating its advantage.
| Teams | Runs | Balls | Dismissals | Average | Run rate |
| All teams | 8385 | 6573 | 377 | 22.24 | 7.65 |
| Excl associate teams | 6827 | 5410 | 299 | 22.82 | 7.57 |
Looking at the team-wise stats, the two African nations come out on top. Zimbabwe's numbers are unexpected, and clearly a result of playing lesser teams: out of 35 ODIs they've featured in since the batting Powerplays came into play, 29 have been against Bangladesh, Kenya or Ireland. They've made good use of that, averaging 8.38 per over, and more than 23 runs per wicket, during these five overs.
South Africa have done even better and are the best of the lot, which isn't a surprise considering their firepower in their batting line-up. Their numbers too are boosted, though, by their two games against Bangladesh, when they scored 66 and 67 runs in the batting Powerplays. (On both occasions they took it in the last five overs.) They've had a few other memorable Powerplay performances, most notably when they scored 53 against Australia in Perth earlier this year.
There's little to choose among the other teams, who all average between 7.18 (England) and 7.89 (New Zealand) per over. Australia and India have done better than the other sides in preserving their wickets, averaging almost 30 per dismissal. On the other hand, Sri Lanka, England and Bangladesh average less than 20, suggesting they've lost too many wickets to make the batting Powerplay count.
| Team | Runs scored | Balls | Wkts lost | Average | Run rate |
| South Africa | 575 | 394 | 21 | 27.38 | 8.76 |
| Zimbabwe | 673 | 482 | 29 | 23.21 | 8.38 |
| New Zealand | 695 | 530 | 34 | 20.44 | 7.87 |
| Australia | 1254 | 966 | 42 | 29.86 | 7.79 |
| India | 833 | 649 | 28 | 29.75 | 7.70 |
| Sri Lanka | 723 | 580 | 37 | 19.54 | 7.48 |
| Pakistan | 619 | 493 | 25 | 24.76 | 7.53 |
| West Indies | 663 | 545 | 30 | 22.10 | 7.30 |
| England | 627 | 518 | 32 | 19.59 | 7.18 |
| Bangladesh | 592 | 530 | 35 | 16.91 | 6.70 |
The batsmen are obviously under the spotlight during the batting powerplays, but the opposition bowlers have a huge role to play as well in spoiling the batsmen's party, and some have done it better than others. Zimbabwe have again taken advantage of playing the lesser teams, but their best bowling performance during the batting Powerplay came against a non-minnow: against Sri Lanka in Harare last year, they took 5 for 23, which remains one of only two instances of five wickets falling during a batting Powerplay (excluding games involving the Associate teams). The only other instance was by India, against Pakistan in the Champions Trophy earlier this year. They lost 6 for 41 in the last five overs, which was also the batting Powerplay, but by then they had already done enough damage to ensure they topped 300 and won comfortably. India have regularly been among the wickets during these Powerplays, and are one of only two teams - ZImbabwe are the other - to average less than 20 runs per wicket.
Apart from Zimbabwe, the only other team which has conceded less than seven runs per over during the batting Powerplays is Pakistan. Their varied and incisive bowling attack has limited opposition batsmen to only 6.48 runs per over. Their best display was against India in the Champions Trophy, when they took 4 for 16 and demolished the Indian tail.
New Zealand's bowlers, on the other hand, have struggled utterly during this period of the innings. Their first ODI against Pakistan in Abu Dhabi was a good illustration of how badly they lose the plot during the batting Powerplays - they leaked 55 runs without taking a wicket in that match, and pushed their overall bowling average during these five overs to 43.28, easily the poorest among all teams. They are also one of only two teams to concede more than eight runs per over.
| Team | Runs conceded | Balls | Wkts taken | Average | Run rate |
| Zimbabwe | 563 | 522 | 40 | 14.07 | 6.47 |
| Pakistan | 474 | 439 | 19 | 24.95 | 6.48 |
| India | 857 | 701 | 51 | 16.80 | 7.33 |
| Sri Lanka | 587 | 468 | 21 | 27.95 | 7.52 |
| Australia | 1028 | 811 | 51 | 20.16 | 7.60 |
| South Africa | 619 | 476 | 27 | 22.92 | 7.80 |
| Bangladesh | 686 | 522 | 29 | 23.65 | 7.88 |
| England | 766 | 579 | 34 | 22.53 | 7.94 |
| New Zealand | 779 | 573 | 18 | 43.28 | 8.16 |
| West Indies | 708 | 513 | 26 | 27.23 | 8.28 |
The table below clinching evidence of the fact that captains prefer waiting till the final overs to take the Powerplay. Teams have mostly taken it after the 40th over, while there are very few instances of it being taken early in an innings. One instance of both teams doing just that was in a Sri Lanka-India match at the Premadasa Stadium earlier this year: India batted first and took the batting Powerplay in the 17th over, immediately after the bowling one. The move made a lot of sense too - Yuvraj Singh was unbeaten on 66 from 46 balls at that stage, while Virender Sehwag was on 34 from 32. Forty-three came from those five overs, both Yuvraj and Sehwag went on to make hundreds, and India amassed 363. Sri Lanka followed India's lead and took the batting Powerplay in the 16th, but managed only 26 runs for a wicket, and ultimately lost by a whopping 147 runs.
| Team | before 25th | 25th to 39th | 40th onwards |
| Australia | 2 | 13 | 19 |
| Bangladesh | 1 | 6 | 13 |
| England | 0 | 9 | 9 |
| India | 3 | 9 | 8 |
| New Zealand | 2 | 8 | 9 |
| Pakistan | 0 | 6 | 11 |
| South Africa | 0 | 3 | 11 |
| Sri Lanka | 3 | 4 | 15 |
| West Indies | 2 | 11 | 5 |
| Zimbabwe | 0 | 4 | 13 |
| Total | 13 | 73 | 113 |
The highest in a batting Powerplay so far is Zimbabwe's 77 against Kenya earlier this year, which helped them amass 351. They took the Powerplay in the 45th over, with the score at 260 for 4. By the end of five more overs, the score had advanced to 337 for 6.
Among the top eight teams, the highest is India's 69 against New Zealand in Christchurch. That was another example of the Indians opting for an early Powerplay with two well-set batsmen at the crease: this time it was Sachin Tendulkar (on 58 from 65 balls) who was with Yuvraj (34 from 37) when the Powerplay was taken in the 23rd over. By the end of the next five overs, Yuvraj had galloped to 78 from 54, with Tendulkar on 82 from 78. India scored 392, and won comfortably by 58 runs.
The stats exclude 16 ODIs, mostly involving the Associate teams, for which Powerplay data was unavailable. All stats updated till the fifth ODI between India and Australia in Hyderabad.
S Rajesh is stats editor of Cricinfo