The favourites for the Champions Trophy
Recent form in ODIs and results in South Africa suggest the hosts, Australia and India are the best bets to lift the trophy
S Rajesh
18-Sep-2009
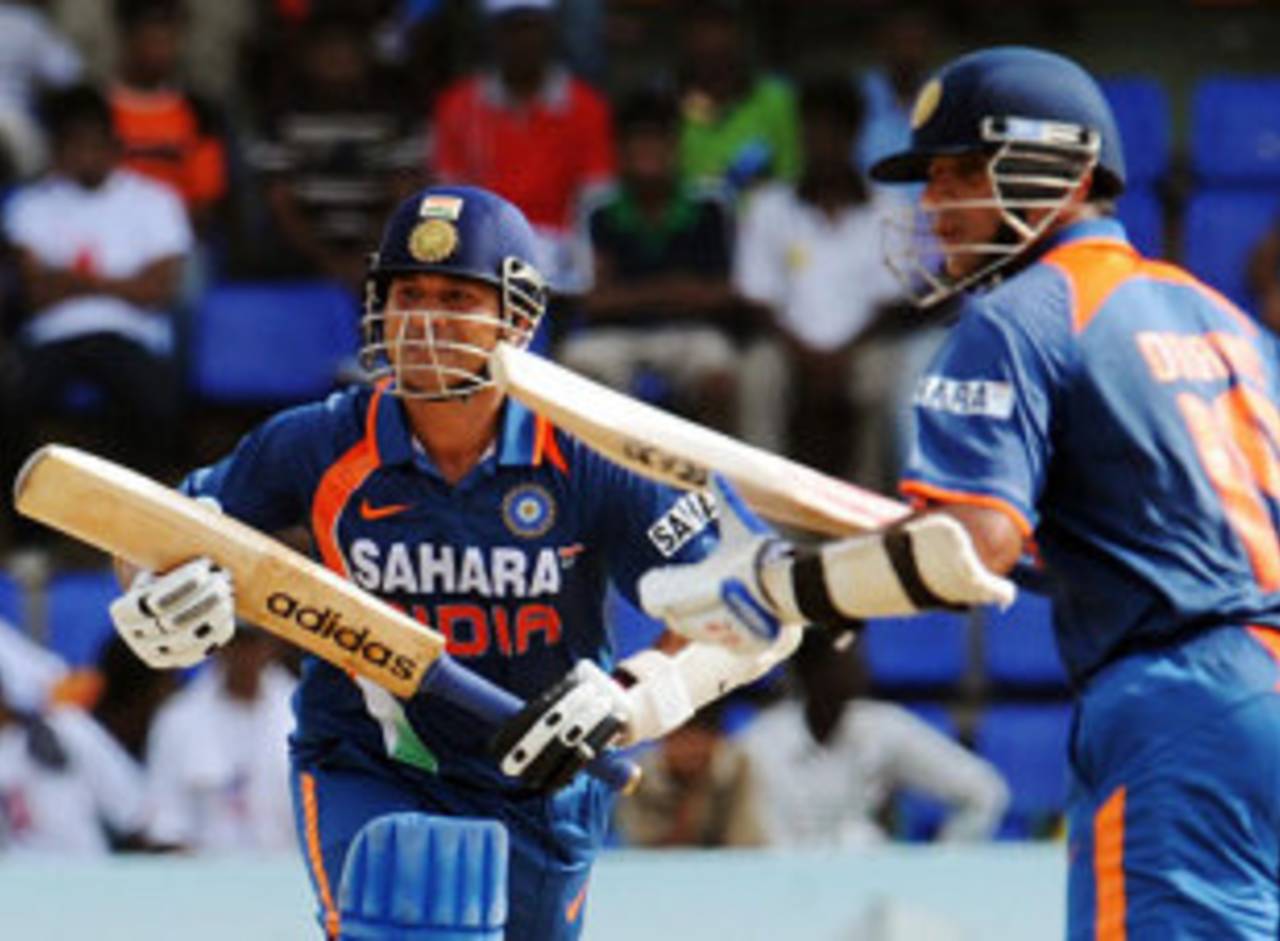
Rahul Dravid has scored nine fifties in 17 ODI innings against the top teams in South Africa, but Sachin Tendulkar hasn't been as successful • AFP
The one-day format has come under much flak recently, but it'll get a huge shot at redemption over the next couple of weeks with the Champions Trophy, which, under a new format, will feature the best teams and the best teams only. All eight teams, barring a weakened West Indian outfit, have a shot at the title, but if recent form - over the last few years and in the country where the tournament is being held - is any indication, the winners will be one of Australia, South Africa or India.
They are the three top teams in the ICC ratings, with only one point separating them - Australia and South Africa are on 127, with India on 126. However, the gap between the third- and fourth-ranked teams is 17 points, with Pakistan on 109.
The stats of teams since the last Champions Trophy - which finished on November 5, 2006 - back the rankings completely. Australia, South Africa and India are the only teams to win more games than they've lost against the top eight teams. India have a win-loss ratio of 1.40, and the next best is New Zealand, with 0.88, which indicates just how big the gulf has been between the top three and the rest during this period.
During this period India have won 11 out of 17 series (including multilateral tournaments), of which six have been on the trot, the latest being the Compaq Cup in Sri Lanka. Australia have won six out of 12, but one of those was the 2007 World Cup. South Africa have won seven out of 10, including five out of five at home.
| Team | ODIs | W/ L = ratio | Bat ave | RPO | Bowl ave | RPO |
| Australia | 70 | 43/ 23 = 1.86 | 37.12 | 5.33 | 27.76 | 4.97 |
| South Africa | 46 | 28/ 16 = 1.75 | 35.37 | 5.31 | 29.10 | 4.93 |
| India | 78 | 42/ 30 = 1.40 | 33.87 | 5.38 | 33.69 | 5.41 |
| New Zealand | 55 | 22/ 25 = 0.88 | 31.00 | 5.20 | 34.53 | 5.15 |
| Pakistan | 44 | 20/ 23 = 0.86 | 30.97 | 4.99 | 34.15 | 5.31 |
| Sri Lanka | 60 | 25/ 31 = 0.80 | 28.98 | 4.96 | 28.58 | 4.94 |
| England | 62 | 25/ 34 = 0.73 | 28.74 | 5.00 | 31.40 | 5.19 |
| West Indies | 49 | 11/ 34 = 0.32 | 27.09 | 4.99 | 36.91 | 5.34 |
Not only have these three teams been the best everywhere in the last three years, they're also the top three in South Africa since the beginning of this decade (against the top eight sides). The home team have been by far the most dominant, which makes them - notwithstanding their ability to somehow lose key games - the favourites for the trophy. Australia have an excellent record here as well, thanks largely to their 2003 World Cup success, but India's stats in South Africa are considerably worse than their record elsewhere - in 14 matches, they've only won five, four of which came during their glorious run to the final in the 2003 World Cup.
India's numbers in South Africa aren't great, but five other teams have done much worse. Pakistan, for example, have a 20% success-rate, the same as West Indies, while New Zealand and Sri Lanka aren't much better.
| Team | ODIs | W/L = ratio | Bat ave | RPO | Bowl ave | RPO |
| South Africa | 87 | 58/ 21 = 2.76 | 37.14 | 5.21 | 28.04 | 4.83 |
| Australia | 27 | 17/ 9 = 1.88 | 34.45 | 5.32 | 29.19 | 5.08 |
| India | 14 | 5/ 9 = 0.55 | 24.82 | 4.66 | 35.93 | 5.11 |
| England | 14 | 3/ 9 = 0.33 | 27.77 | 4.59 | 27.22 | 4.67 |
| Sri Lanka | 17 | 4/ 12 = 0.33 | 25.53 | 4.52 | 39.73 | 5.27 |
| New Zealand | 19 | 3/ 14 = 0.21 | 27.52 | 4.70 | 37.07 | 4.94 |
| West Indies | 13 | 2/ 10 = 0.20 | 28.43 | 4.86 | 44.35 | 5.27 |
| Pakistan | 13 | 2/ 10 = 0.20 | 23.98 | 4.72 | 38.20 | 5.61 |
The individual batting stats of players in South Africa offer some interesting insights too. For one, it explains - partially at least - why Rahul Dravid was brought back into the Indian team. He leads the averages chart among batsmen who'll be playing in the tournament - in 17 innings (against the top eight teams only) he has notched up nine half-centuries. Ricky Ponting and Jacques Kallis, the mainstays for Australia and South Africa, are next on the list. Only three other batsmen average more than 40.
On the other hand, there are several big names who'll be looking to improve their stats. Sachin Tendulkar, for instance, averages less than 32, with five 50-plus scores in 26 innings. Sanath Jayasuriya and Mohammad Yousuf haven't done much better. Sri Lanka's other big batting stars have struggled too - Kumar Sangakkara averages 28.85, while Mahela Jayawardene has embarrassing numbers: in 20 innings he has scored a total of 280 runs. In fact, the last time Sri Lanka toured South Africa was for the 2003 World Cup, a tournament in which Jayawardene had a shocker. His last eight innings in the country (against the top teams) read thus: 9, 3, 1, 9, 1, 0, 0, 5. That explains why Sri Lanka's record in South Africa is so poor.
| Batsman | ODIs | Runs | Average | Strike rate | 100s/ 50s |
| Rahul Dravid | 17 | 737 | 56.69 | 67.42 | 0/ 9 |
| Ricky Ponting | 22 | 1031 | 54.26 | 94.06 | 4/ 4 |
| Jacques Kallis | 113 | 4080 | 46.89 | 74.33 | 6/ 28 |
| JP Duminy | 13 | 398 | 44.22 | 81.72 | 0/ 2 |
| Michael Hussey | 10 | 338 | 42.25 | 93.62 | 0/ 3 |
| AB de Villiers | 34 | 1159 | 41.39 | 85.22 | 0/ 9 |
| Graeme Smith | 56 | 2079 | 39.98 | 83.72 | 3/ 16 |
| Herschelle Gibbs | 87 | 2739 | 34.23 | 82.97 | 9/ 9 |
| Sanath Jayasuriya | 29 | 899 | 32.10 | 81.72 | 2/ 5 |
| Mohammad Yousuf | 18 | 509 | 31.81 | 77.12 | 1/ 2 |
| Sachin Tendulkar | 26 | 822 | 31.61 | 73.92 | 1/ 4 |
| Kumar Sangakkara | 17 | 404 | 28.85 | 68.94 | 0/ 2 |
| Mark Boucher | 101 | 1522 | 27.67 | 82.58 | 0/ 5 |
| Michael Clarke | 10 | 243 | 27.00 | 71.68 | 0/ 3 |
| Brendon McCullum | 12 | 237 | 26.33 | 69.50 | 0/ 1 |
| Paul Collingwood | 10 | 181 | 25.85 | 78.35 | 0/ 1 |
| Younis Khan | 13 | 336 | 25.84 | 67.74 | 0/ 2 |
| Yuvraj Singh | 10 | 180 | 22.50 | 81.08 | 0/ 1 |
| Shahid Afridi | 13 | 206 | 17.16 | 120.46 | 0/ 1 |
| Mahela Jayawardene | 20 | 280 | 14.73 | 61.81 | 0/ 1 |
Among the bowlers, most of the wicket-takers have been the fast men. Brett Lee leads the way with an excellent haul of 41 wickets in just 19 games, with three four-wicket hauls and a five-for. Shane Bond and Makhaya Ntini have been among the wickets as well. The spinners have reasonable economy-rates, but apart from Muttiah Muralitharan, they haven't had a lot of wicket-taking success.
| Bowler | ODIs | Wickets | Average | Econ rate |
| Brett Lee | 19 | 41 | 21.75 | 5.30 |
| Shane Bond | 10 | 17 | 24.52 | 4.80 |
| Makhaya Ntini | 67 | 99 | 26.75 | 4.69 |
| Muttiah Muralitharan | 22 | 31 | 27.80 | 4.06 |
| Dale Steyn | 10 | 16 | 30.12 | 5.18 |
| Nathan Bracken | 10 | 14 | 32.14 | 5.21 |
| Jacques Kallis | 113 | 95 | 33.30 | 5.09 |
| Daniel Vettori | 12 | 11 | 36.00 | 4.00 |
| Shahid Afridi | 13 | 12 | 37.75 | 4.81 |
| Harbhajan Singh | 11 | 10 | 44.10 | 4.72 |
| Johan Botha | 10 | 8 | 48.50 | 4.27 |
| Sanath Jayasuriya | 29 | 16 | 55.18 | 5.23 |
S Rajesh is stats editor of Cricinfo