Samaraweera sizzles in his second innings
Since his return to the team, Thilan Samaraweera has added a whole new dimension to his game
S Rajesh
28-Aug-2009
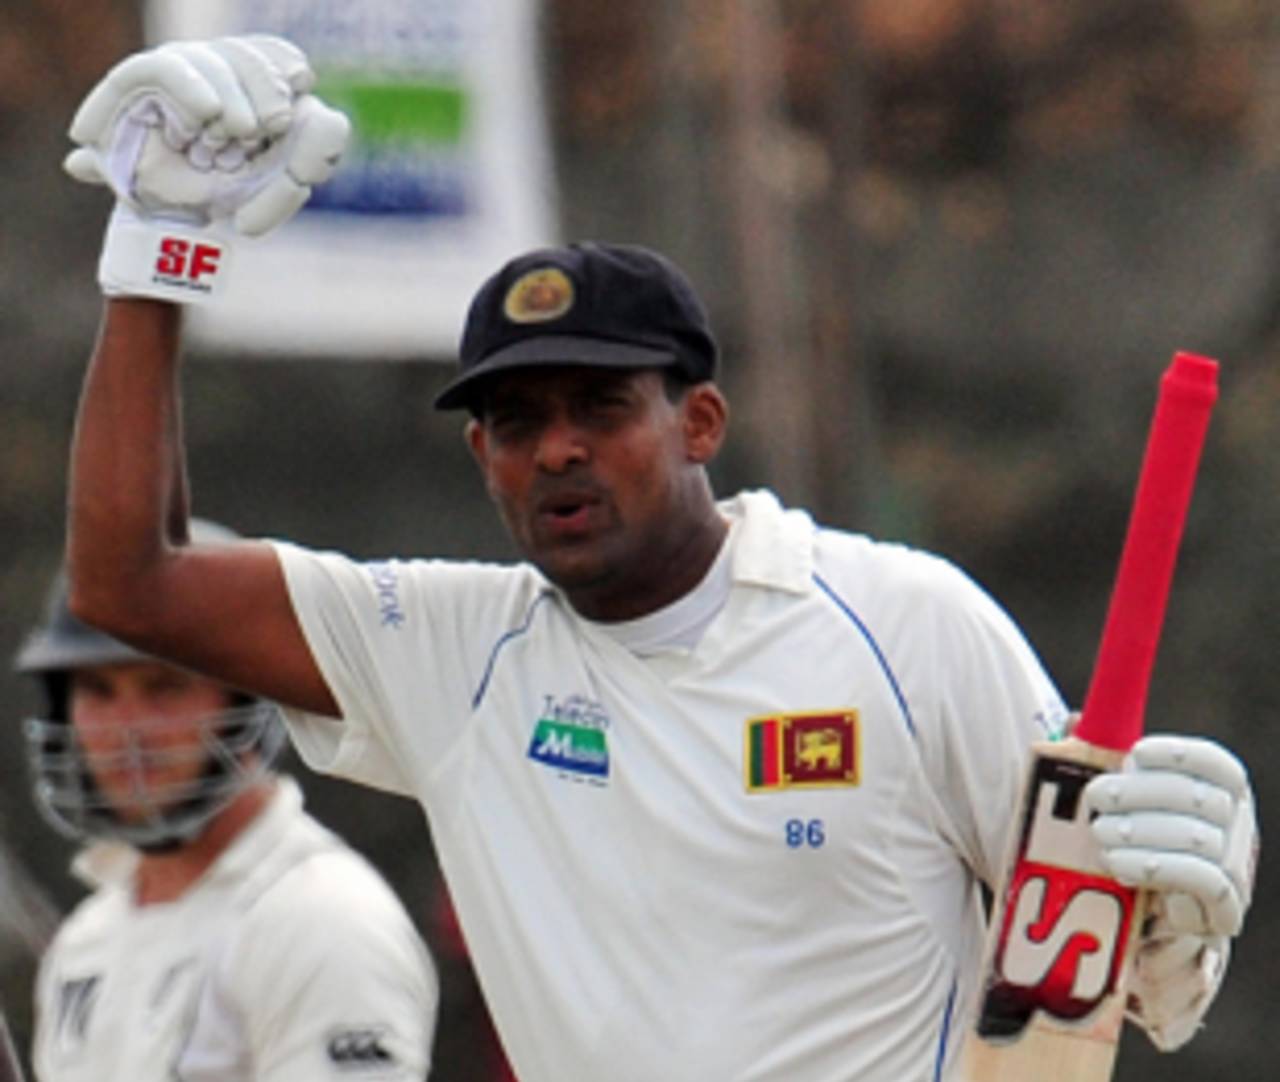
Thilan Samaraweera averages more than 76 in his last 15 Tests, with six centuries during this period • AFP
Last week, the Numbers Game spotlight was on Tillakaratne Dilshan; this time the focus shifts to his Sri Lankan team-mate, Thilan Samaraweera, another batsman who has returned from international wilderness and suddenly found a whole new dimension to his game.
There's a lot more the two batsmen share than the country they represent - Samaraweera is the older of the two by just 22 days, and their Test numbers are pretty similar too. Dilshan has played three more Tests, though Samaraweera has the higher aggregate (3762 to 3410) and the better average (52.25 to 43.16)
Much of that difference, though, has been due to the remarkable manner in which Samaraweera has come back after spending almost 18 months away from Test cricket. That absence whetted his appetite for the big league so much that he has been virtually unstoppable since his return. His 143 in the second Test against New Zealand at the SSC was his sixth century in his last 15 Tests, during which period he has averaged an outstanding 76.04. His last five innings before he was dropped, in April and May 2006, read thus - 4, 0, 6, 3, 8. The contrast couldn't be greater from his scores in most recent four Test innings - 73, 159, 20 and 143.
Samaraweera's superb run started in the West Indies, when he scored 125 in a losing cause in Port-of-Spain. That was followed by a century against India, and double-hundreds in successive Tests in Pakistan.
| Period | Runs | Average | Strike-rate | 100s/ 50s | 4s/ 6s |
| First 39 Tests | 2089 | 41.78 | 41.53 | 5/ 13 | 223/ 1 |
| Last 15 Tests | 1673 | 76.04 | 57.66 | 6/ 6 | 227/ 4 |
| Career | 3760 | 52.95 | 47.42 | 11/ 19 | 450/ 5 |
All those runs have meant Samaraweera is comfortably the leading Test batsman over the last 22 months - his average of 76.04 is more than six runs clear of the second-placed Shivnarine Chanderpaul. (The top 10 has four Sri Lankans, which tells another story.)
Samaraweera has already scored four centuries and topped the 1000-run mark in 2009 - only Andrew Strauss has scored more Test runs this year, and the difference is only 13. And while Strauss has played 21 innings for his 1071 runs, Samaraweera has scored 1058 in just 14.
| Batsman | Tests | Runs | Average | Strike-rate | 100s/ 50s |
| Thilan Samaraweera | 15 | 1673 | 76.04 | 57.64 | 6/ 6 |
| Shivnarine Chanderpaul | 17 | 1394 | 69.70 | 41.14 | 5/ 9 |
| Gautam Gambhir | 12 | 1587 | 69.00 | 49.34 | 5/ 7 |
| Mahela Jayawardene | 19 | 2021 | 67.36 | 51.51 | 8/ 5 |
| Tillakaratne Dilshan | 15 | 1258 | 59.90 | 80.79 | 5/ 3 |
| AB de Villiers | 22 | 1670 | 59.64 | 52.73 | 6/ 6 |
| Ramnaresh Sarwan | 14 | 1368 | 59.47 | 53.90 | 6/ 5 |
| Ashwell Prince | 17 | 1119 | 58.89 | 49.51 | 5/ 2 |
| Graeme Smith | 21 | 1811 | 58.41 | 65.42 | 6/ 7 |
| Kumar Sangakkara | 18 | 1707 | 56.90 | 56.46 | 5/ 10 |
The difference, though, has not only been in the number of runs he has scored but also the manner in which he has got them. In his earlier avatar Samaraweera was a dour batsman, with a clear preference for obduracy over flair. While he scored runs then too, he consumed plenty of balls in doing so - his last half-century before being dropped was a 180-ball 65 against Pakistan in Kandy. Shortly before that, he'd scored 58 off 143, and 78 off 198 against Bangladesh. In his first 39 Tests he'd scored at a strike-rate of 41.53 runs per 100 balls, and struck just one six - Grant Flower was the unfortunate bowler. Since his return, his strike-rate has increased to almost 58, and he has struck four sixes in his last three innings - three off Jeetan Patel, and one off Chris Martin. He'll obviously never score as quickly as Dilshan, but the rate is now very acceptable - among the 10 batsmen in the list above, only two have a faster scoring-rate.
The table below lists the batsmen who've scored more than 3000 Test runs since 1990, but struck five or fewer sixes in this period. David Boon and Hashan Tillakaratne lead the list - both struck just one six during this period, and both scored at a strike-rate of around 40. The list has some names you'd expect to see, but also some you wouldn't - Habibul Bashar scored at a strike-rate of 60 in Tests, but only struck four sixes.
| Batsman | Tests | Runs | Average | Strike rate | 100s/ 50s | 4s/ 6s |
| David Boon | 62 | 4303 | 45.29 | 39.99 | 13/ 18 | 474/ 1 |
| Hashan Tillakaratne | 82 | 4539 | 43.64 | 40.32 | 11/ 20 | 540/ 1 |
| Alastair Cook | 48 | 3509 | 42.79 | 47.17 | 9/ 20 | 417/ 2 |
| Mark Butcher | 71 | 4288 | 34.58 | 42.85 | 8/ 23 | 559/ 3 |
| Saleem Malik | 47 | 3126 | 45.97 | 50.68 | 8/ 15 | 395/ 3 |
| Jimmy Adams | 54 | 3012 | 41.26 | 37.57 | 6/ 14 | 313/ 4 |
| Marvan Atapattu | 90 | 5502 | 39.02 | 44.42 | 16/ 17 | 685/ 4 |
| Michael Atherton | 113 | 7655 | 38.08 | 37.34 | 16/ 46 | 897/ 4 |
| Habibul Bashar | 50 | 3026 | 30.87 | 60.27 | 3/ 24 | 401/ 4 |
| VVS Laxman | 105 | 6741 | 45.24 | 49.07 | 14/ 39 | 913/ 4 |
| Ian Healy | 102 | 3949 | 28.61 | 50.22 | 4/ 21 | 389/ 5 |
| Thilan Samaraweera | 54 | 3762 | 52.25 | 47.42 | 11/ 19 | 450/ 5 |
Things have gone superbly for Samaraweera since his comeback, but it's fair to say he's been helped by the opposition and the venues he's played in. Eight of his 15 Tests have been at home, four have been in Bangladesh and Pakistan, and two in the West Indies. He has played only one Test in Australia during this period - he made 33 in two innings - and none in South Africa, England or New Zealand. Tougher challenges undoubtedly await him, and how he tackles them will decide how he'll be rated in the pantheon of Sri Lankan batsmen. For the moment, though, things are going very smoothly - he is the eighth-highest run-getter for Sri Lanka in Tests, and among those with 1000 runs, only two have a better average.
The spin story
Spinners and New Zealand haven't always shared a cosy relationship, but there was reason to celebrate this week when Daniel Vettori reached the 300-wicket milestone. No other left-arm spinner has achieved this feat, which, given the records achieved by offspinners and leggies, says something about this type of bowling. Vettori has also had to battle unfavourable conditions at home, which makes his achievement all the more remarkable. The table below lists the contribution of spin to the total wickets taken by teams since 1980, and it isn't surprising that New Zealand come in at seventh place, with spin accounting for 23% of their wickets.
The leader of the pack, again not surprisingly, is India, the only side for whom spin has contributed more than 50% of the wickets. Sri Lanka and Bangladesh are close behind, while Pakistan is the only other team with a spin contribution of more than 35%. At the other end of the spectrum are South Africa and West Indies, for whom spin has contributed less than 15% of the wickets.
| Team | Spin wkts | Average | 5WI/ 10WM | Tot wkts | Average | % of spin wkts |
| India | 1845 | 34.25 | 88/ 18 | 3563 | 34.86 | 51.78 |
| Sri Lanka | 1322 | 30.08 | 80/ 24 | 2686 | 32.73 | 49.22 |
| Bangladesh | 282 | 46.58 | 17/ 1 | 573 | 51.17 | 49.21 |
| Pakistan | 1322 | 33.68 | 64/ 14 | 3542 | 31.31 | 37.32 |
| Australia | 1539 | 31.12 | 76/ 20 | 5166 | 29.48 | 29.79 |
| Zimbabwe | 275 | 46.68 | 12/ 3 | 985 | 39.84 | 27.92 |
| New Zealand | 698 | 38.92 | 32/ 4 | 2994 | 33.74 | 23.31 |
| England | 1028 | 41.01 | 35/ 4 | 4780 | 34.69 | 21.51 |
| South Africa | 413 | 40.39 | 10/ 1 | 2770 | 29.49 | 14.91 |
| West Indies | 500 | 47.87 | 10/ 0 | 4066 | 31.03 | 12.30 |
S Rajesh is stats editor of Cricinfo