Is top-order batting so difficult in England?
Traditional wisdom suggests facing the new ball is the most difficult proposition in England, but numbers from the last two decades indicate otherwise
S Rajesh
10-Jul-2009
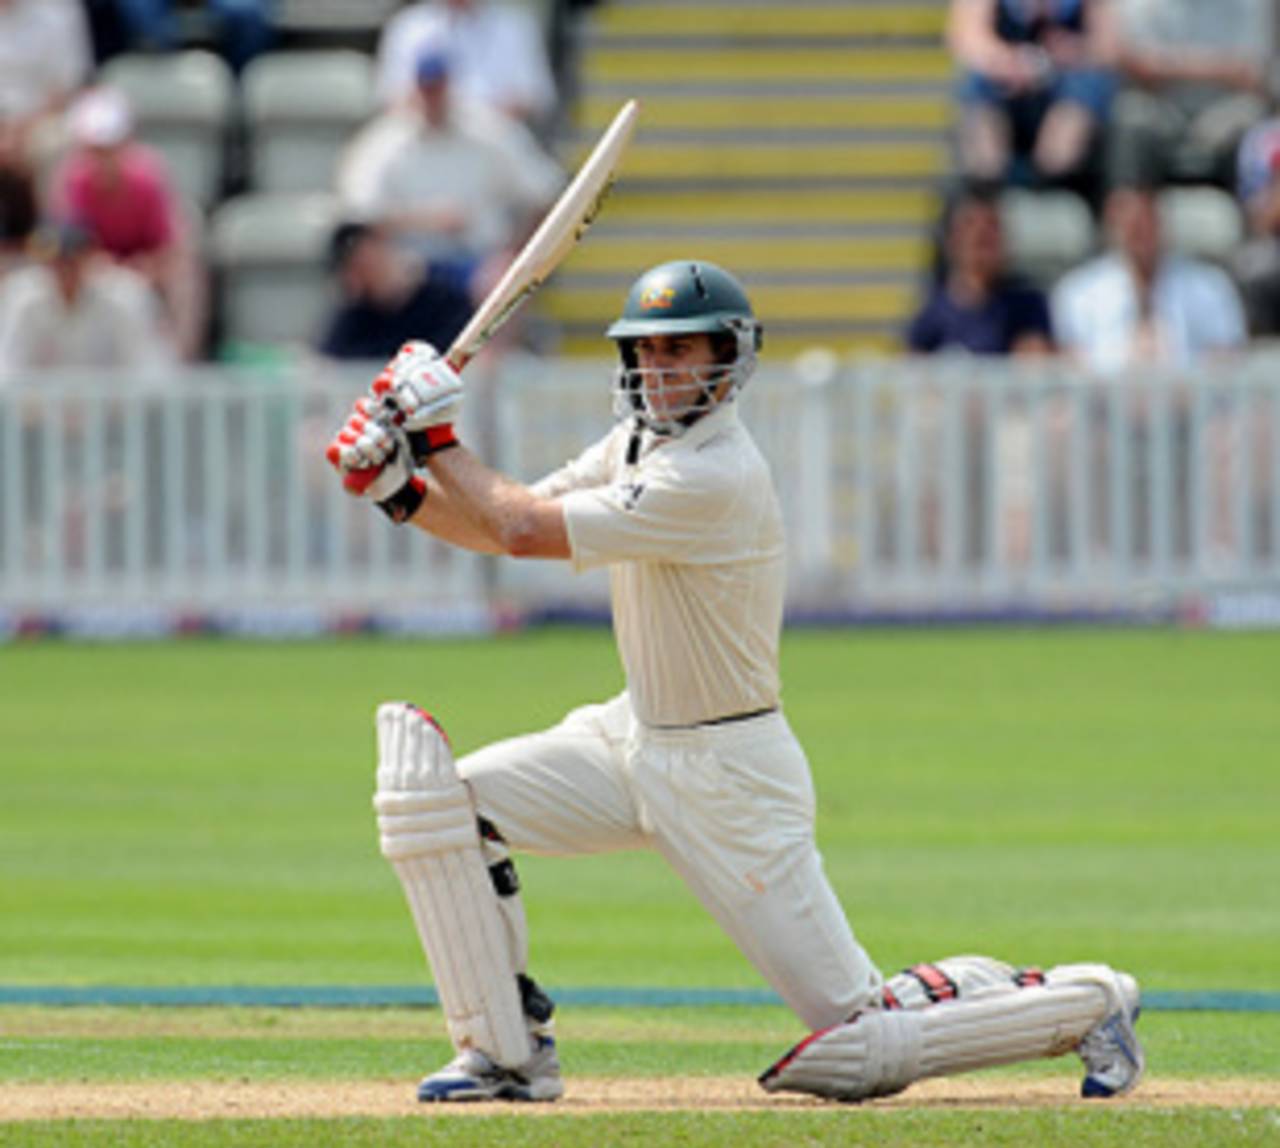
Simon Katich had an excellent time on the second day in Cardiff as Australia's top three made merry • PA Photos
Looking ahead to the 2009 Ashes series and Australia's chances of winning it, Matthew Hayden, who had opened the batting with limited success in the 2005 series, had a couple of interesting points to make. "We saw reverse-swing come into the game last series and I expect to see the same thing this time," he said. "If we see No. 1 to No. 3 managing themselves nicely, it puts the middle order into a position where they can be a bit more comfortable against the reverse ball, and you do have to have that strength."
Then, elaborating on the job in store for the Australian top order, he said: "England is a challenging place for an opening combination. The engine room of cricket is No. 1 to No. 3 and they have to get off to a good start, but in England it's the most challenging time to bat."
Do the numbers corroborate these observations? Is the early part really the most challenging time to bat in England, or are the later periods more difficult? The two tables below compare partnerships for each of the top seven wickets in each country in Tests since 2000, and the results indicate Hayden wasn't spot on regarding his observation about the difficulties in England for top-order batsmen.
The average opening partnership in England during this period is 42.81 - only in India have openers done better - while the mean for the second wicket is 44.66, next only to Australia and India. Combining the stats for the first two wickets, the average stand in England is 43.77, with only India (45.29) and Australia (44.16) having a higher average. In 470 partnerships for the first two wickets in England, there've been 48 century and 91 half-century stands, a percentage of 29.57, which compares reasonably well with the percentages in Australia (30.17) and India (32.51).
| Host country | 1st wkt | 2nd wkt | 3rd wkt | 4th wkt | 5th wkt | 6th wkt | 7th wkt |
| Australia | 41.43 | 47.00 | 43.84 | 51.43 | 39.66 | 37.28 | 27.59 |
| Bangladesh | 38.59 | 35.72 | 30.43 | 38.12 | 37.48 | 39.28 | 28.32 |
| England | 42.81 | 44.66 | 46.29 | 45.32 | 39.41 | 36.44 | 24.28 |
| India | 45.20 | 45.39 | 45.05 | 43.71 | 48.70 | 38.63 | 32.84 |
| New Zealand | 30.66 | 35.42 | 35.76 | 40.58 | 42.10 | 37.81 | 38.73 |
| Pakistan | 41.81 | 43.70 | 57.03 | 53.92 | 44.57 | 38.28 | 24.47 |
| South Africa | 38.08 | 39.53 | 46.52 | 37.29 | 33.22 | 31.90 | 28.72 |
| Sri Lanka | 38.41 | 35.53 | 49.40 | 40.70 | 35.62 | 36.47 | 27.00 |
| West Indies | 41.22 | 42.49 | 43.42 | 48.07 | 45.74 | 38.42 | 28.34 |
| Zimbabwe | 35.96 | 41.28 | 41.50 | 47.53 | 30.57 | 38.66 | 29.09 |
As the table above indicates, the problems for batsmen seem to exacerbate later in the innings: the average stands for the fifth to seventh wickets is lower in absolute numbers and in comparison with corresponding partnerships in other countries. England slots in at sixth place for the average fifth-wicket partnership, at ninth place for the sixth wicket, and it scrapes the bottom for the seventh wicket, which suggests reverse swing and its perils are a big factor in England.
Grouping the partnerships for the first four and the next three wickets together, it's clear that, compared to other countries, England is a relatively better place for batting in the early part of the innings. That gives the lie to the commonly held belief that conditions in England aid swing and new-ball bowling, and are hence difficult to negotiate at the start of an innings.
| Host country | Wkts 1-4: ave stand | 100/ 50 p'ships | Wkts 4-7: ave stand | 100/ 50 p'ships |
| India | 44.85 | 71/ 124 | 40.37 | 42/ 65 |
| New Zealand | 35.51 | 46/ 81 | 39.58 | 33/ 63 |
| West Indies | 43.75 | 85/ 112 | 37.76 | 39/ 72 |
| Pakistan | 48.94 | 60/ 95 | 36.02 | 24/ 40 |
| Bangladesh | 35.73 | 32/ 57 | 35.19 | 17/ 51 |
| Australia | 45.83 | 95/ 159 | 35.02 | 33/ 99 |
| England | 44.69 | 107/ 168 | 33.56 | 37/ 105 |
| Sri Lanka | 40.96 | 62/ 140 | 33.17 | 38/ 57 |
| Zimbabwe | 41.36 | 31/ 47 | 32.81 | 11/ 33 |
| South Africa | 40.40 | 70/ 128 | 31.34 | 24/ 71 |
It's been a bigger battle for the lower-middle order in England, but there have been some very successful pairs for wickets five to seven, most notably Andrew Flintoff and Geraint Jones, who put together four century stands in 11 attempts, including one of 177 at Trent Bridge against Australia in 2005. Among overseas pairs, West Indies' Shivnarine Chanderpaul and Dwayne Bravo have been the most successful over the last decade, with an average stand of 80.50 in 10 innings. Their last seven partnerships have all yielded at least a half-century.
Things haven't been as impressive for some other pairs, though: Flintoff and Alec Stewart averaged 17.12 in eight innings, while Flintoff and Bell averaged 14.60 in five. (Click here for the full list.)
| Pair | Innings | Runs | Average stand | 100/ 50 p'ships |
| Flintoff-Jones | 11 | 836 | 83.60 | 4/ 2 |
| Bell-Prior | 6 | 416 | 83.20 | 1/ 2 |
| Bravo-Chanderpaul | 10 | 805 | 80.50 | 2/ 6 |
| Collingwood-Pietersen | 7 | 505 | 72.14 | 2/ 3 |
| de Villiers-Prince | 5 | 338 | 67.60 | 1/ 1 |
| Gilchrist-Martyn | 5 | 301 | 60.20 | 1/ 1 |
| Bell-Collingwood | 13 | 537 | 48.81 | 2/ 1 |
| Flintoff-Thorpe | 7 | 339 | 48.42 | 0/ 4 |
Has England become an easier place for top-order batting in the last few years? Stats from the 1990s and 1980s seem to suggest so: in the 1980s England was among the more difficult places for top-order partnerships, but in the 1990s it eased up considerably. The average stand for the top two wickets in the 90s was 41.71, the highest among all countries. In the '80s, it had been 35.61, with only New Zealand and Sri Lanka faring worse.
| Host country | 1980s - Ave stand | 100/ 50 p'ships | 1990s - Ave stand | 100/ 50 p'ships |
| Australia | 38.13 | 34/ 75 | 36.95 | 30/ 79 |
| Bangladesh | - | - | 23.00 | 0/ 1 |
| England | 35.61 | 28/ 63 | 41.71 | 41/ 76 |
| India | 39.56 | 22/ 54 | 39.88 | 22/ 41 |
| New Zealand | 33.78 | 14/ 28 | 38.39 | 25/ 47 |
| Pakistan | 35.85 | 18/ 55 | 37.32 | 19/ 33 |
| South Africa | - | - | 28.34 | 9/ 42 |
| Sri Lanka | 25.51 | 2/ 10 | 38.27 | 17/ 33 |
| West Indies | 41.77 | 23/ 31 | 35.92 | 22/ 46 |
| Zimbabwe | - | - | 32.59 | 13/ 21 |
S Rajesh is stats editor of Cricinfo