Win the toss, win the match
The toss has played a huge role in deciding the fate of ODIs at the Premadasa Stadium
Siddhartha Talya
14-Sep-2009
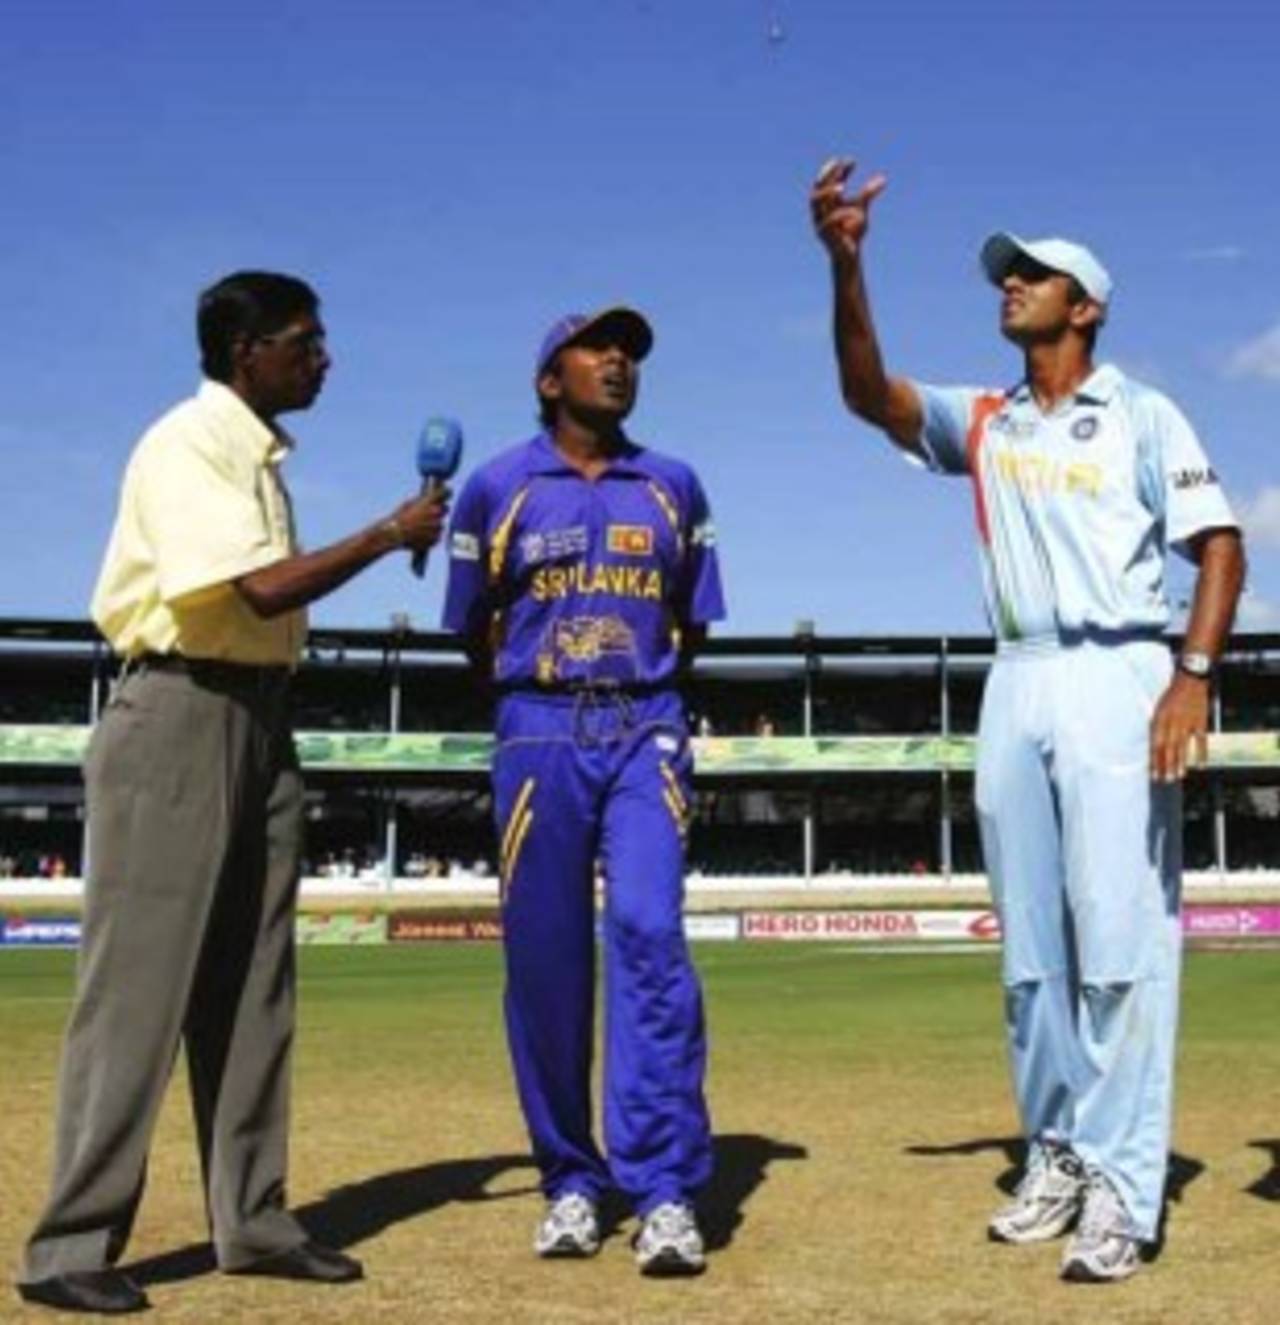
Different captains and a different venue but the same ritual may play a decisive role in the outcome • Getty Images
India's six-wicket win over New Zealand in the Compaq Cup was an aberration; their 139-run defeat in the next game against Sri Lanka restored normalcy. It's not that India are a poor team - they are ranked No.3 in ODIs - but the result was consistent with the trend at the Premadasa Stadium.
- Sri Lanka won the toss and batted; 17 out of 23 times have teams done that at the Premadasa since 2005.
Among international venues, the result of the toss has influenced the outcome of the game most at the Gaddafi Stadium in Lahore and the Premadasa. If one were to consider the top eight teams, 84% of the matches at the Premadasa since 2005 have been won by the side winning the toss, while in Lahore, it's 87%. If one were to narrow it down to teams winning the toss and batting, the figure for Premadasa rises to 88%.
Apart from the conditions at the Premadasa, which favour batting early on and deteriorate later in the day, the captains would be prompted to bat by the sizeable margin of victories for the side batting first at the venue. India's comprehensive loss in the dead rubber is a case in point, as they collapsed to their biggest defeat, in terms of runs, on Sri Lankan soil. The difference in the average runs-per-wicket between the side batting first and the side chasing, since 2005, is the biggest at the Premadasa, and by a fair margin (considering the top eight teams). The team batting first has a 12.08 run advantage here, while Newlands in Cape Town takes second place with 9.06. (Click here for average runs-per-wicket for each venue in the first innings and here in the second. Qualification of a minimum of eight matches since 2005.)
| Venue | First innings | Second innings | Difference |
| Premadasa Stadium, Colombo, Sri Lanka | 33.05 | 20.97 | 12.08 |
| Newlands, Cape Town, South Africa | 31.86 | 22.80 | 9.06 |
| Gaddafi Stadium, Lahore, Pakistan | 37.77 | 29.22 | 8.55 |
| AMI Stadium, Christchurch, New Zealand | 37.70 | 31.10 | 6.60 |
| Eden Park, Auckland, New Zealand | 35.80 | 29.23 | 6.57 |
| Sydney Cricket Ground, Sydney, Australia | 34.17 | 28.17 | 6 |
| Sheikh Zayed Stadium, Abu Dhabi, UAE | 31.29 | 30.30 | 0.99 |
The Premadasa boasts a turning track, but overall, it's the seamers who've done better here. Angelo Mathews' 6 for 20 underscored the assistance bowlers like him, with sly variations in pace and the ability to cut the ball both ways, can derive from the track. In the first innings, seamers outdo spinners comfortably, averaging 32.62 as opposed to 47.42. But in the second innings, the slow bowlers improve their stats remarkably. The difference in the bowling averages is reduced to 3.13 runs. (Click for overall stats for seamers and spinners, and for seamers in the second innings.)
| Span | Pace (Wickets and average) | Economy rate | Strike rate | 4w/5w | Spin (Wickets and Average) | Economy rate | Strike rate | 4w/5w |
| Overall | 184 at 26.39 | 4.84 | 32.7 | 5/5 | 94 at 34 | 4.58 | 44.5 | 2/0 |
| 1st innings | 86 at 32.62 | 5.05 | 38.6 | 0/2 | 40 at 47.42 | 4.94 | 57.6 | 0/0 |
| 2nd innings | 98 at 20.92 | 4.57 | 27.4 | 5/3 | 54 at 24.05 | 4.14 | 34.8 | 2/0 |
Siddhartha Talya is an editorial assistant at Cricinfo